Checklist functions
Damiano Oldoni
Source:vignettes/checklist-functions.Rmd
checklist-functions.RmdThis vignette demonstrates the main checklist functions in the trias package for analyzing and visualizing alien species data.
Load data
We’ll use example data from the TrIAS indicators repository:
df <- read_tsv(
  "https://raw.githubusercontent.com/trias-project/indicators/master/data/interim/data_input_checklist_indicators.tsv",
  show_col_types = FALSE
)

# Preview the data
head(df)
#> # A tibble: 6 × 38
#>         key  nubKey scientificName datasetKey canonicalName species genus family
#>       <dbl>   <dbl> <chr>          <chr>      <chr>         <chr>   <chr> <chr>
#> 1 152543101 5740285 Gyrodactylus … 6d9e952f-… Gyrodactylus… Gyroda… Gyro… Gyrod…
#> 2 152543101 5740285 Gyrodactylus … 6d9e952f-… Gyrodactylus… Gyroda… Gyro… Gyrod…
#> 3 152543102 3202936 Aphanomyces a… 6d9e952f-… Aphanomyces … Aphano… Apha… Lepto…
#> 4 152543110 5179027 Scutigera col… 6d9e952f-… Scutigera co… Scutig… Scut… Scuti…
#> 5 152543110 5179027 Scutigera col… 6d9e952f-… Scutigera co… Scutig… Scut… Scuti…
#> 6 152543110 5179027 Scutigera col… 6d9e952f-… Scutigera co… Scutig… Scut… Scuti…
#> # ℹ 30 more variables: order <chr>, class <chr>, phylum <chr>, kingdom <chr>,
#> #   rank <chr>, speciesKey <dbl>, genusKey <dbl>, familyKey <dbl>,
#> #   orderKey <dbl>, classKey <dbl>, phylumKey <dbl>, kingdomKey <dbl>,
#> #   taxonomicStatus <chr>, locationId <chr>, locality <chr>, country <chr>,
#> #   status <chr>, first_observed <dbl>, last_observed <dbl>,
#> #   establishmentMeans <chr>, degree_of_establishment <chr>,
#> #   native_range <chr>, native_continent <chr>, habitat <chr>, marine <lgl>, …
Time of introduction
Number of introductions per year
The indicator_introduction_year() function shows how
many new alien species were introduced each year.
# Plot number of new introductions per year
result <- indicator_introduction_year(
  df = df,
  start_year_plot = 1950,
  smooth_span = 0.85
)
#> [1] "All column names present"
#> [1] "All column names present"

# Display the plot
result$plot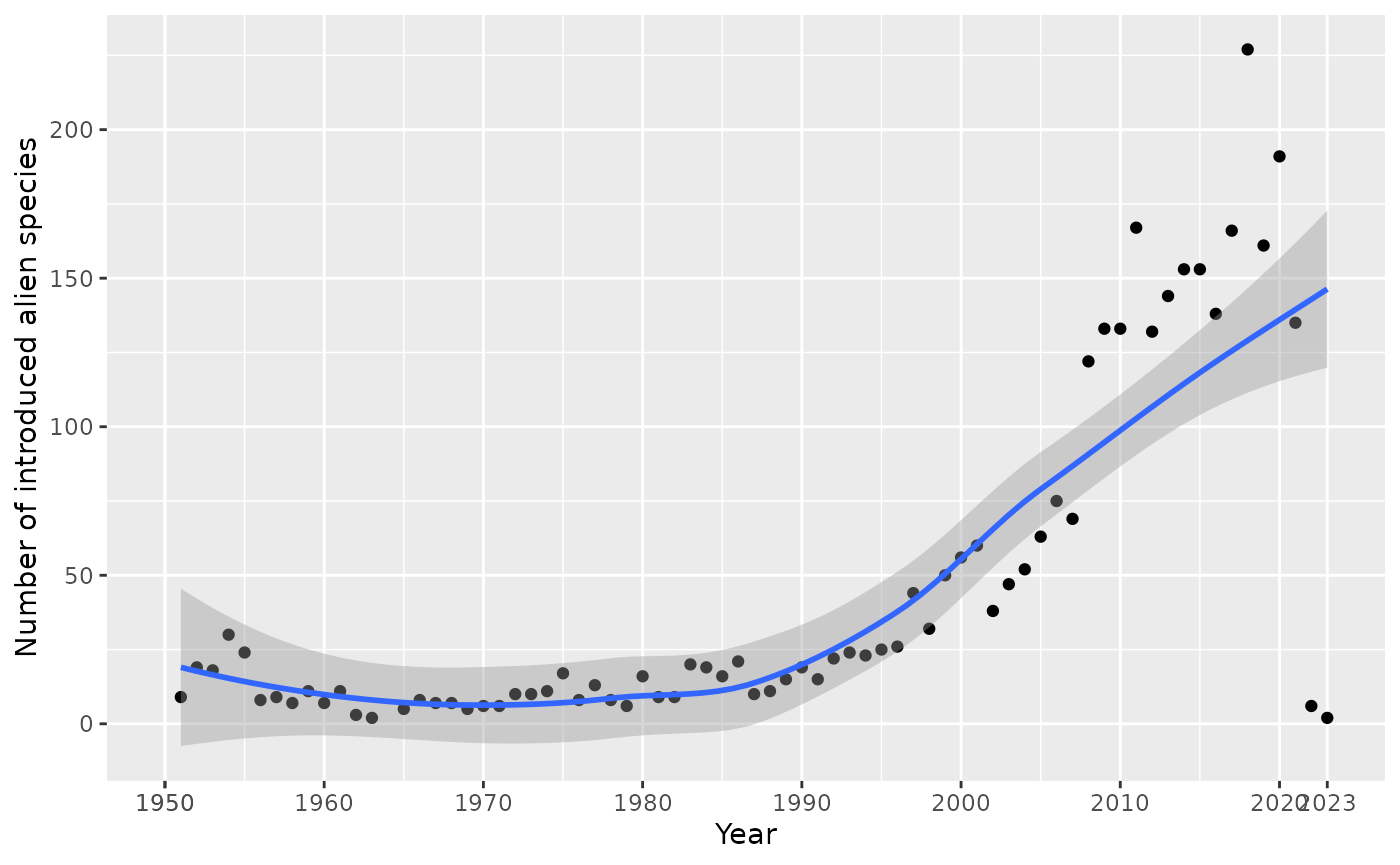
Cumulative number of alien species
The indicator_total_year() function displays the
cumulative number of alien species over time.
# Plot cumulative number of alien species
result <- indicator_total_year(
  df = df,
  start_year_plot = 1950
)
#> [1] "All column names present"
#> [1] "All column names present"

# Display the plot
result$plot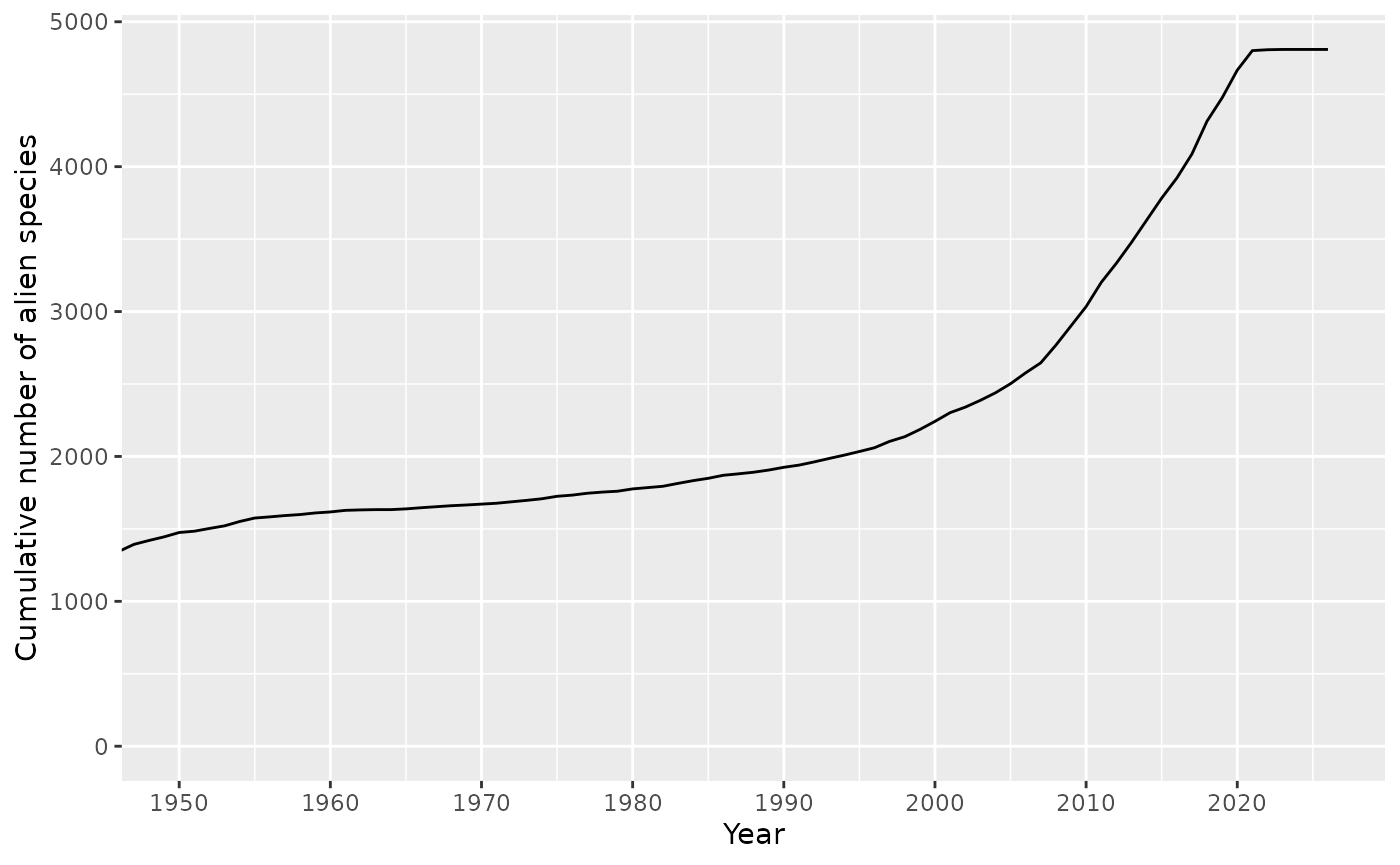
Native range
The indicator_native_range_year() function creates an
interactive visualization showing the number of alien species per native
region and year of introduction.
# Plot species by native range over time
result <- indicator_native_range_year(
  df = df,
  type = "native_range",
  response_type = "absolute"
)
#> [1] "All column names present"
#> [1] "All column names present"

# Display the plot
result$plot
#> NULL
Pathways of introduction
Pathway data
The package includes the pathwayscbd dataset containing
CBD standard pathways at level 1 and level 2.
# View available CBD pathways
pathwayscbd
#> # A tibble: 51 × 2
#>    pathway_level1 pathway_level2
#>    <chr>          <chr>
#>  1 release        biological_control
#>  2 release        erosion_control
#>  3 release        fishery
#>  4 release        hunting
#>  5 release        landscape_improvement
#>  6 release        conservation
#>  7 release        use
#>  8 release        other
#>  9 release        unknown
#> 10 escape         agriculture
#> # ℹ 41 more rows
Visualize pathways at level 1
The visualize_pathways_level1() function creates bar
graphs showing the number of taxa introduced through different CBD
pathways at level 1.
# Visualize pathways level 1
result <- visualize_pathways_level1(
  df = df,
  category = NULL,
  from = NULL
)
#> [1] "All column names present"
#> [1] "All column names present"
#> [1] "All column names present"
#> [1] "All column names present"
#> [1] "All column names present"

# Display the plot
result$plot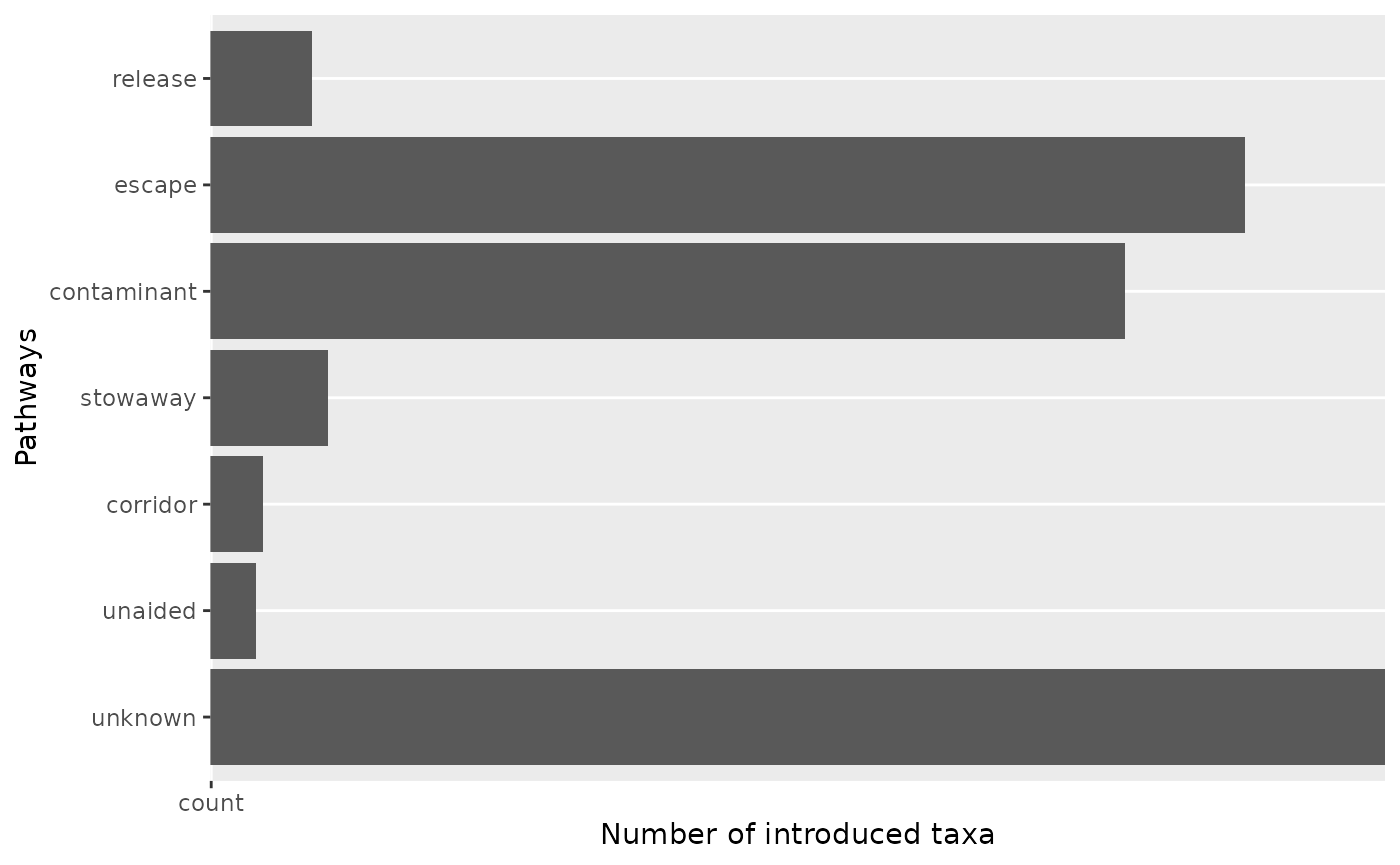
Visualize pathways over time at level 1
The visualize_pathways_year_level1() function shows
pathway trends over time.
# Visualize pathways level 1 over time
result <- visualize_pathways_year_level1(
  df = df,
  bin = 10,
  from = 1970
)
#> [1] "All column names present"
#> [1] "All column names present"
#> [1] "All column names present"
#> [1] "All column names present"
#> [1] "All column names present"

# Display the plot
result$plot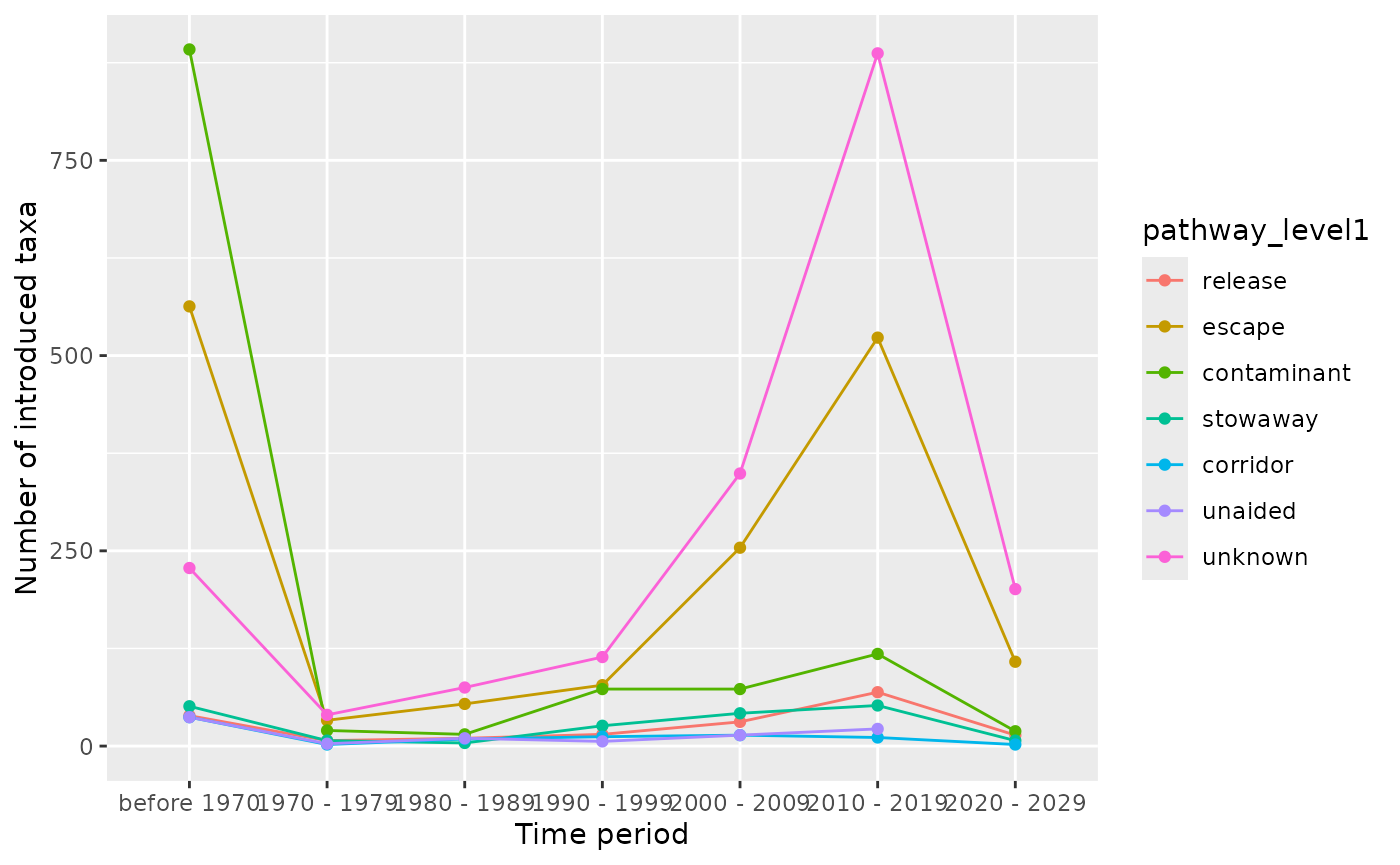
Visualize pathways at level 2
The visualize_pathways_level2() function creates bar
graphs for CBD pathways at level 2 for a specific level 1 pathway.
# Visualize pathways level 2 for "escape"
result <- visualize_pathways_level2(
  df = df,
  chosen_pathway_level1 = "escape",
  category = NULL
)
#> [1] "All column names present"
#> [1] "All column names present"
#> [1] "All column names present"
#> [1] "All column names present"
#> [1] "All column names present"
#> [1] "All column names present"

# Display the plot
result$plot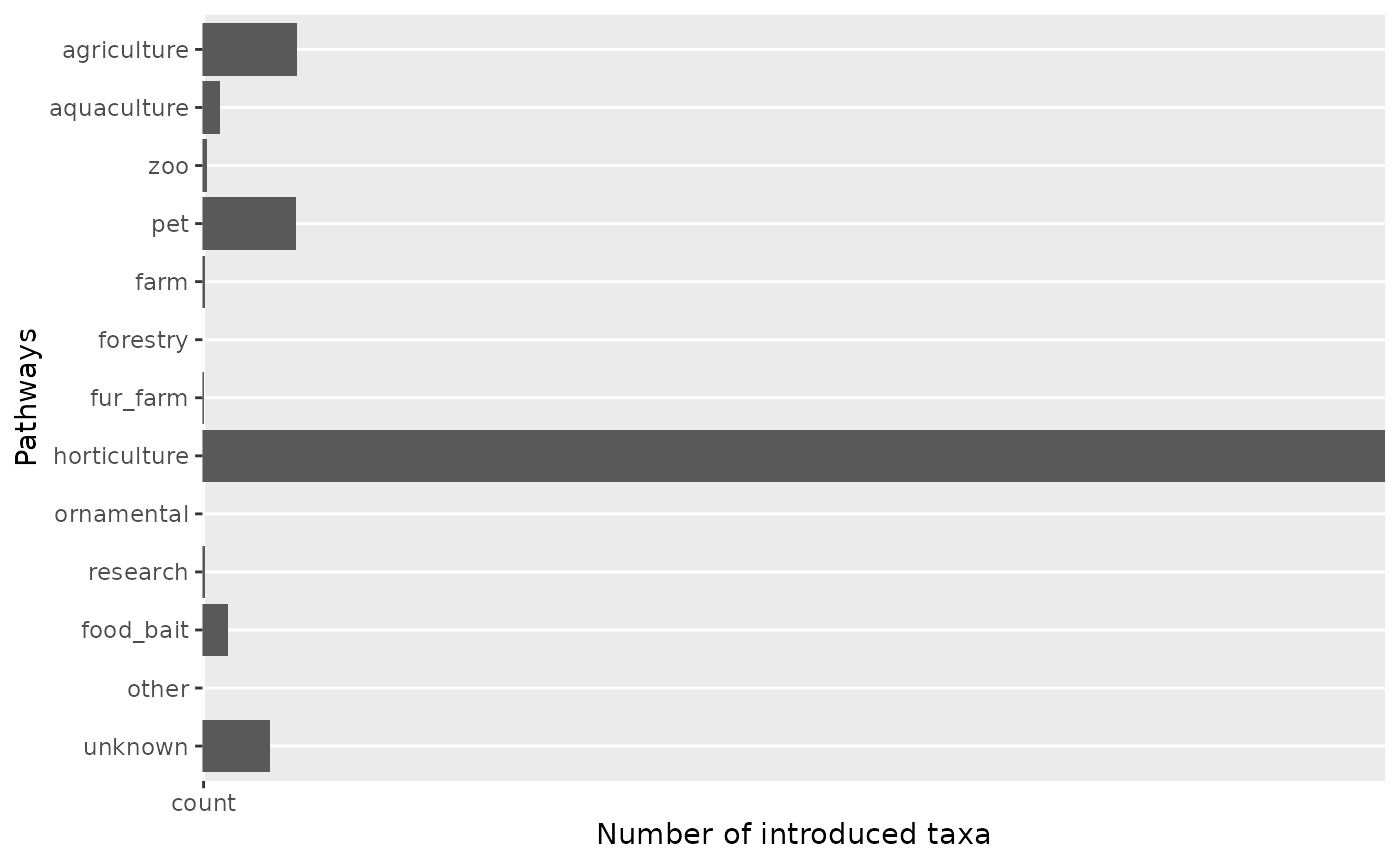
Visualize pathways over time at level 2
The visualize_pathways_year_level2() function shows
level 2 pathway trends over time for a specific level 1 pathway.
# Visualize pathways level 2 over time
result <- visualize_pathways_year_level2(
  df = df,
  chosen_pathway_level1 = "escape",
  bin = 10,
  from = 1970
)
#> [1] "All column names present"
#> [1] "All column names present"
#> [1] "All column names present"
#> [1] "All column names present"
#> [1] "All column names present"
#> [1] "All column names present"

# Display the plot
result$plot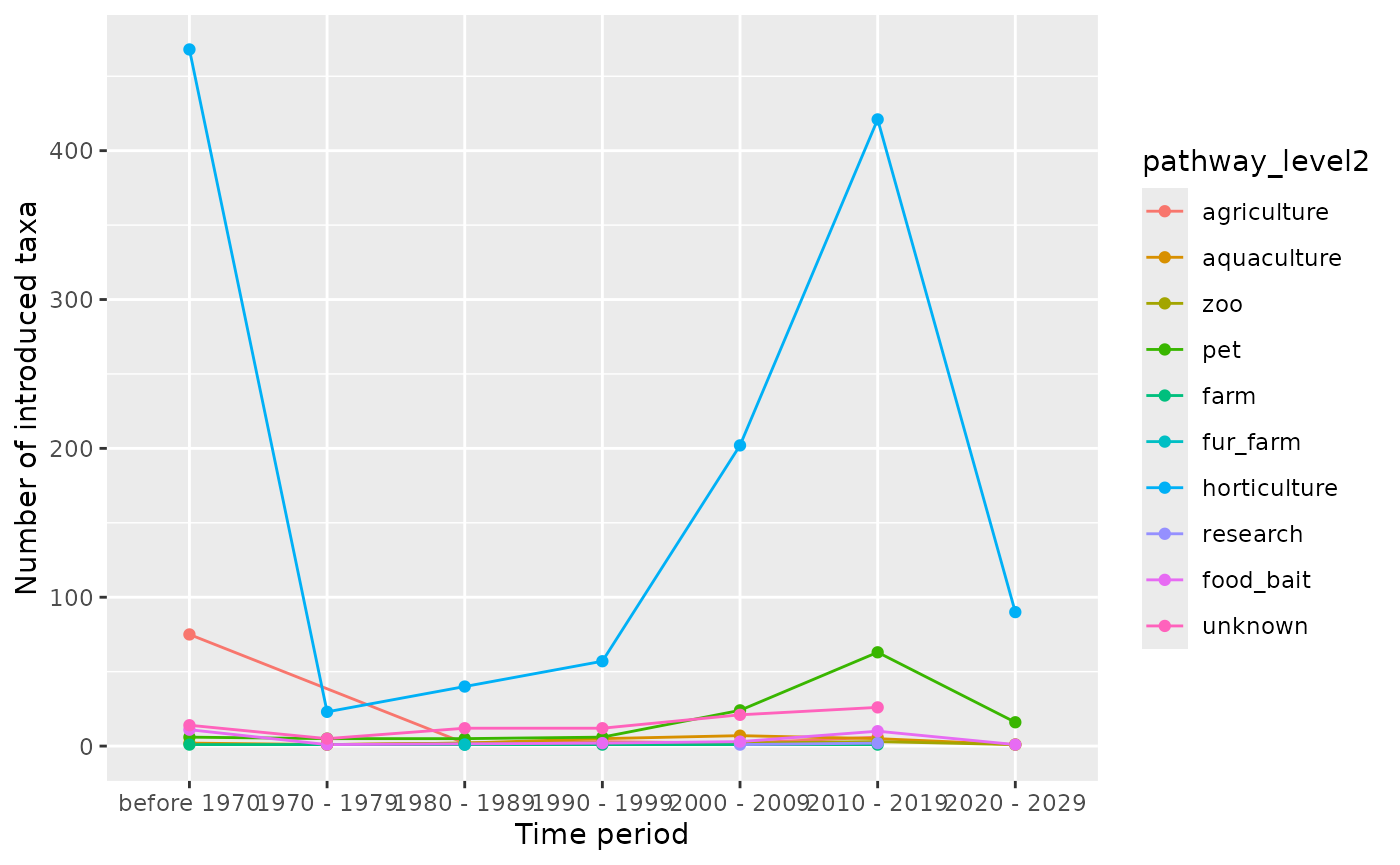
Pathway count table
The get_table_pathways() function creates a summary
table with the number of taxa per pathway and example species.
# Get pathway count table
pathway_table <- get_table_pathways(
  df = df,
  category = NULL,
  from = NULL,
  n_species = 5
)
#> [1] "All column names present"
#> [1] "All column names present"

# Display first rows
head(pathway_table)
#> # A tibble: 6 × 4
#>   pathway_level1 pathway_level2       n examples
#>   <chr>          <chr>            <int> <chr>
#> 1 contaminant    animal_parasite      3 Mastophorus, Enderleinellus kumadai, Ho…
#> 2 contaminant    food                 1 Chaetopelma olivaceum
#> 3 contaminant    habitat_material   102 Centaurea psammogena, Odontites jaubert…
#> 4 contaminant    nursery             24 Oenanthe pimpinelloides, Euphorbia hype…
#> 5 contaminant    on_animals         560 Juncus foliosus, Panicum antidotale, Le…
#> 6 contaminant    on_plants           35 Ferussacia folliculum, Branchiodrilus h…
Additional resources
For more information on individual functions, see the Reference page.