Indicator: Number of new introductions of alien species per year
Damiano Oldoni
Yasmine Verzelen
Stijn Van Hoey
Tim Adriaens
2023-11-08
This document describes how to build indicators of Invasive Alien Species based on checklist data. In particular, this document takes into account the number of new introductions of alien species per year in Belgium.
1 Setup
Load libraries:
library(tidyverse) # To do datascience
library(magrittr) # To use extract2 function
library(tidylog) # To provide feedback on dplyr functions
library(rlang) # To use Standard Evaluation in dplyr (!!sym())
library(here) # To find files
library(trias) # To use functions developed for TrIAS
library(INBOtheme) # To use INBO theme for graphs
2 Get data
data_file <- here::here(
  "data",
  "interim",
  "data_input_checklist_indicators.tsv"
)
data <- read_tsv(data_file,
  na = "",
  guess_max = 5000
)
3 Number of new introductions of alien species per year
We use function indicator_introduction_year from
trias library.
3.1 Select data from Belgium
We select data at national level (no regional distributions):
data <-
  data %>%
  tidylog::filter(locationId == "ISO_3166:BE")
3.2 Grouping by kingdom
We group data by kingdom:
facet_column <- "kingdom"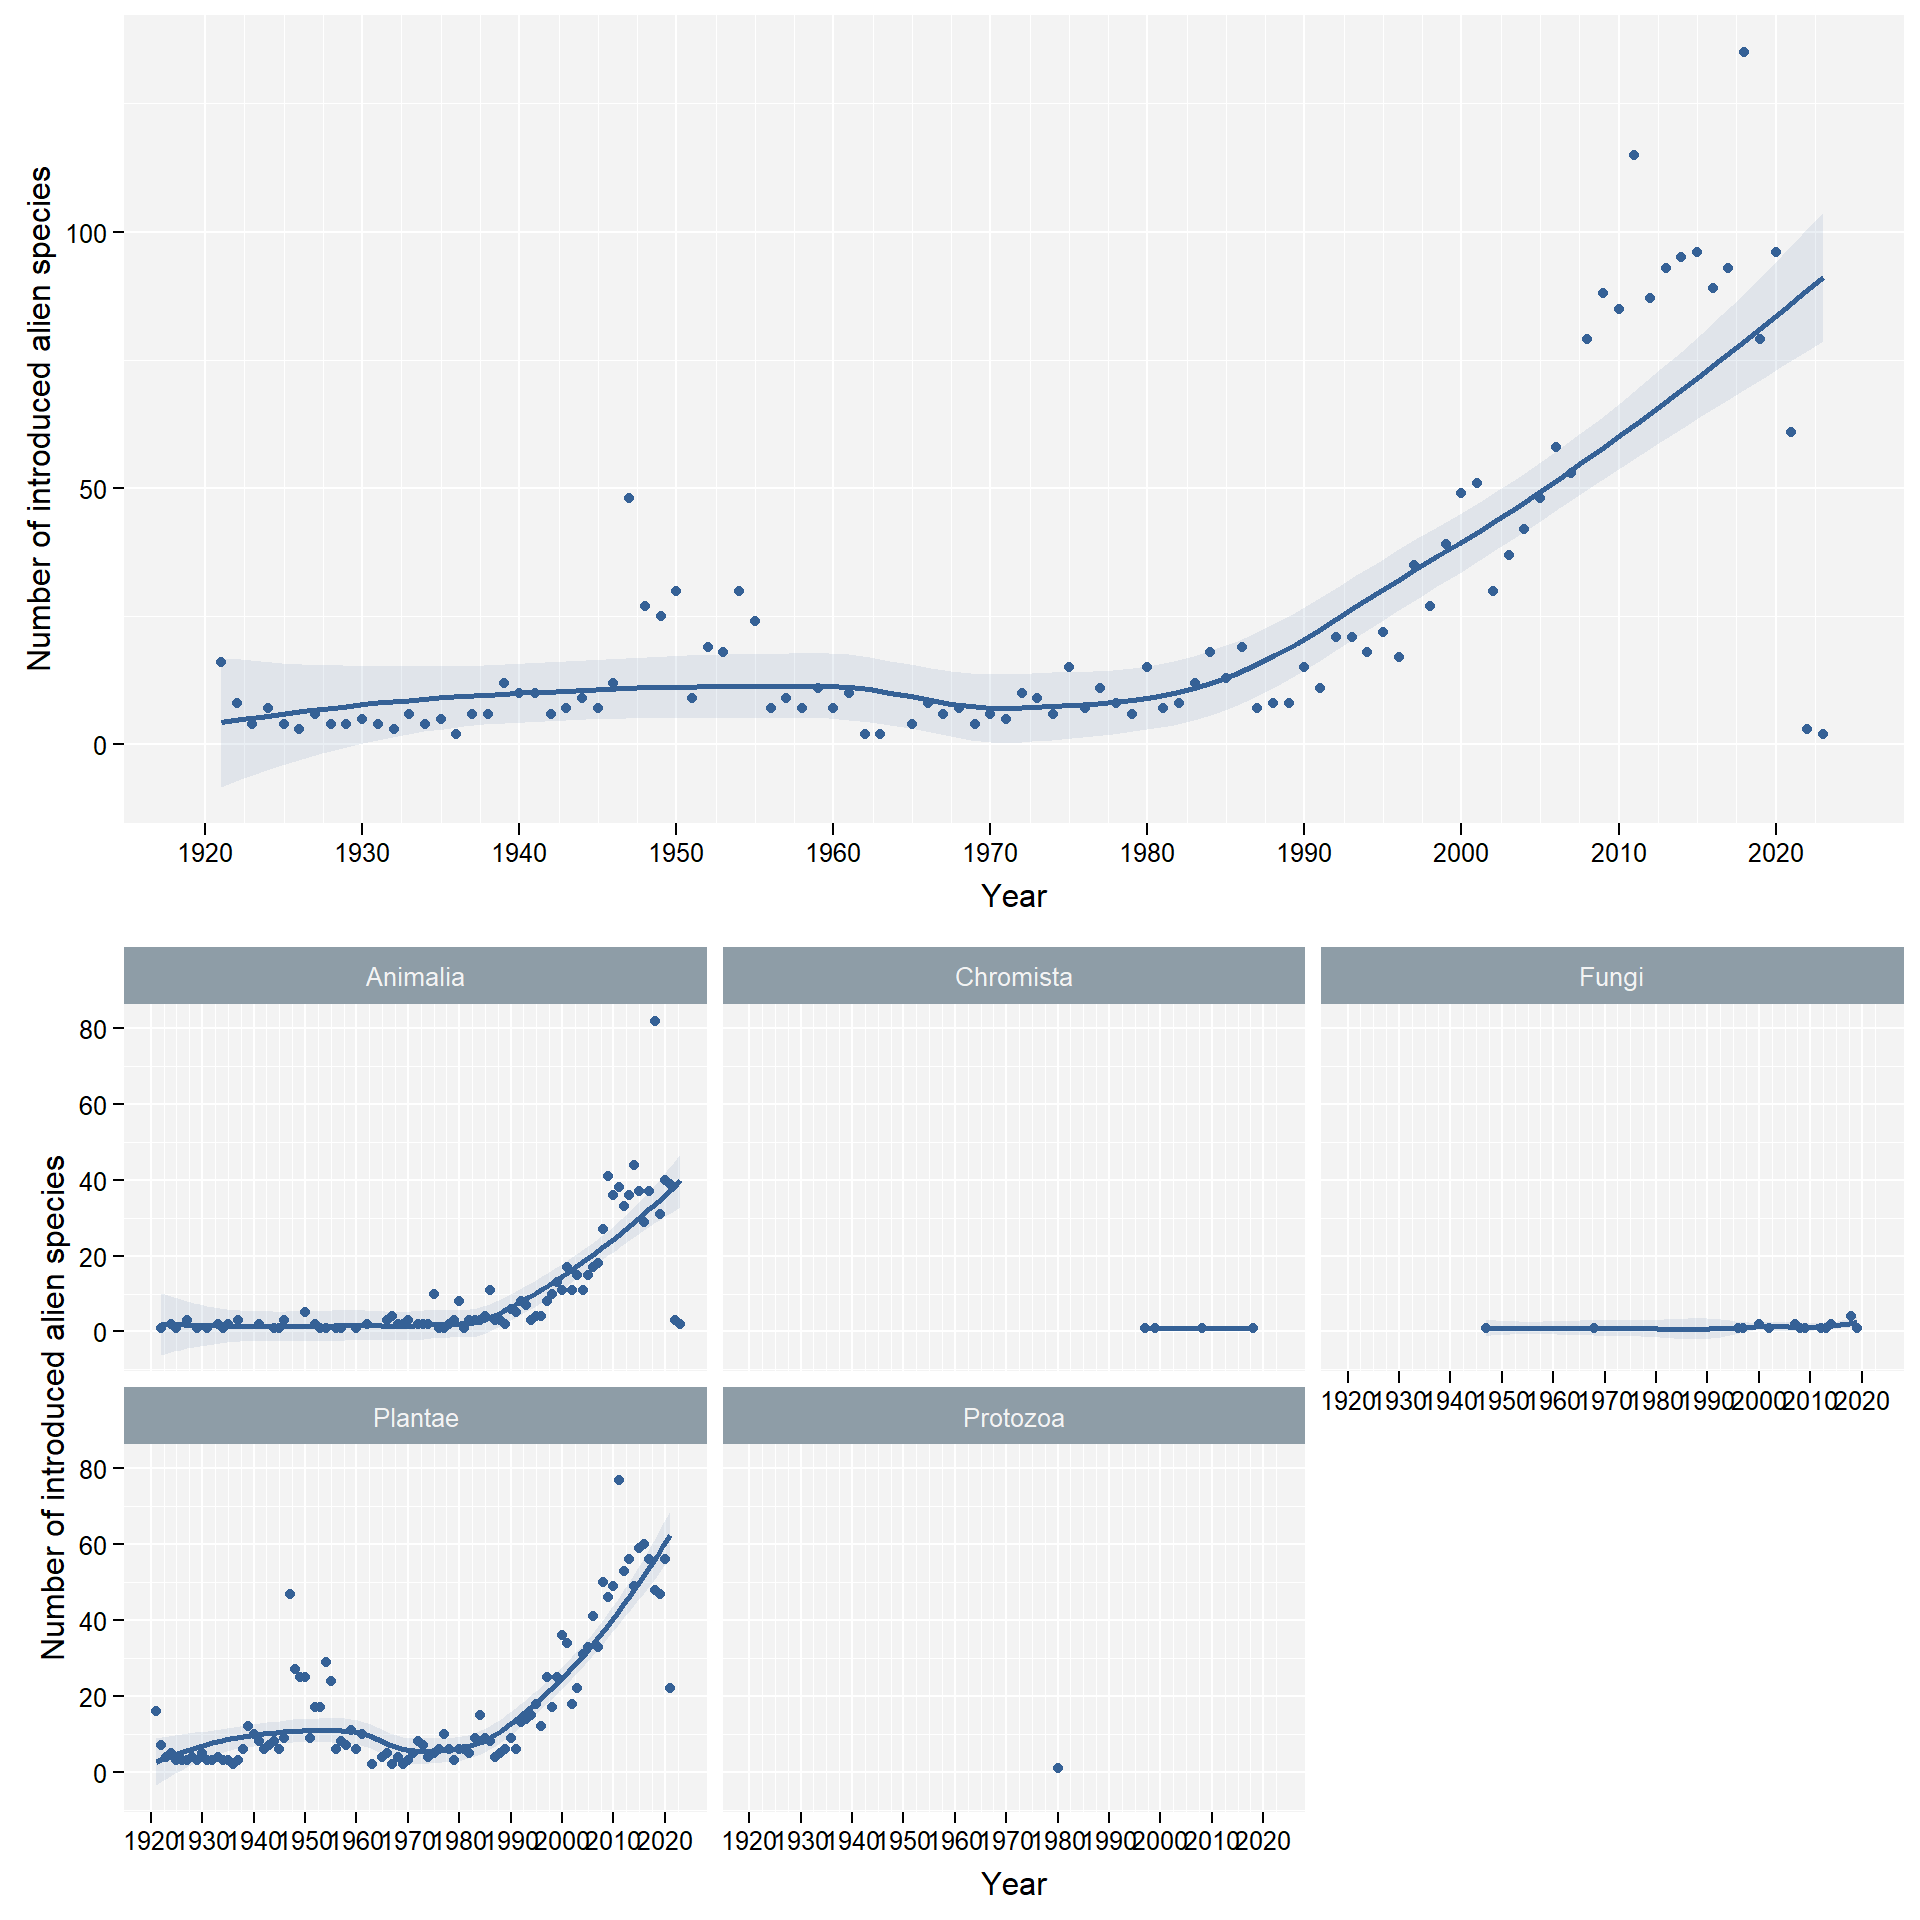
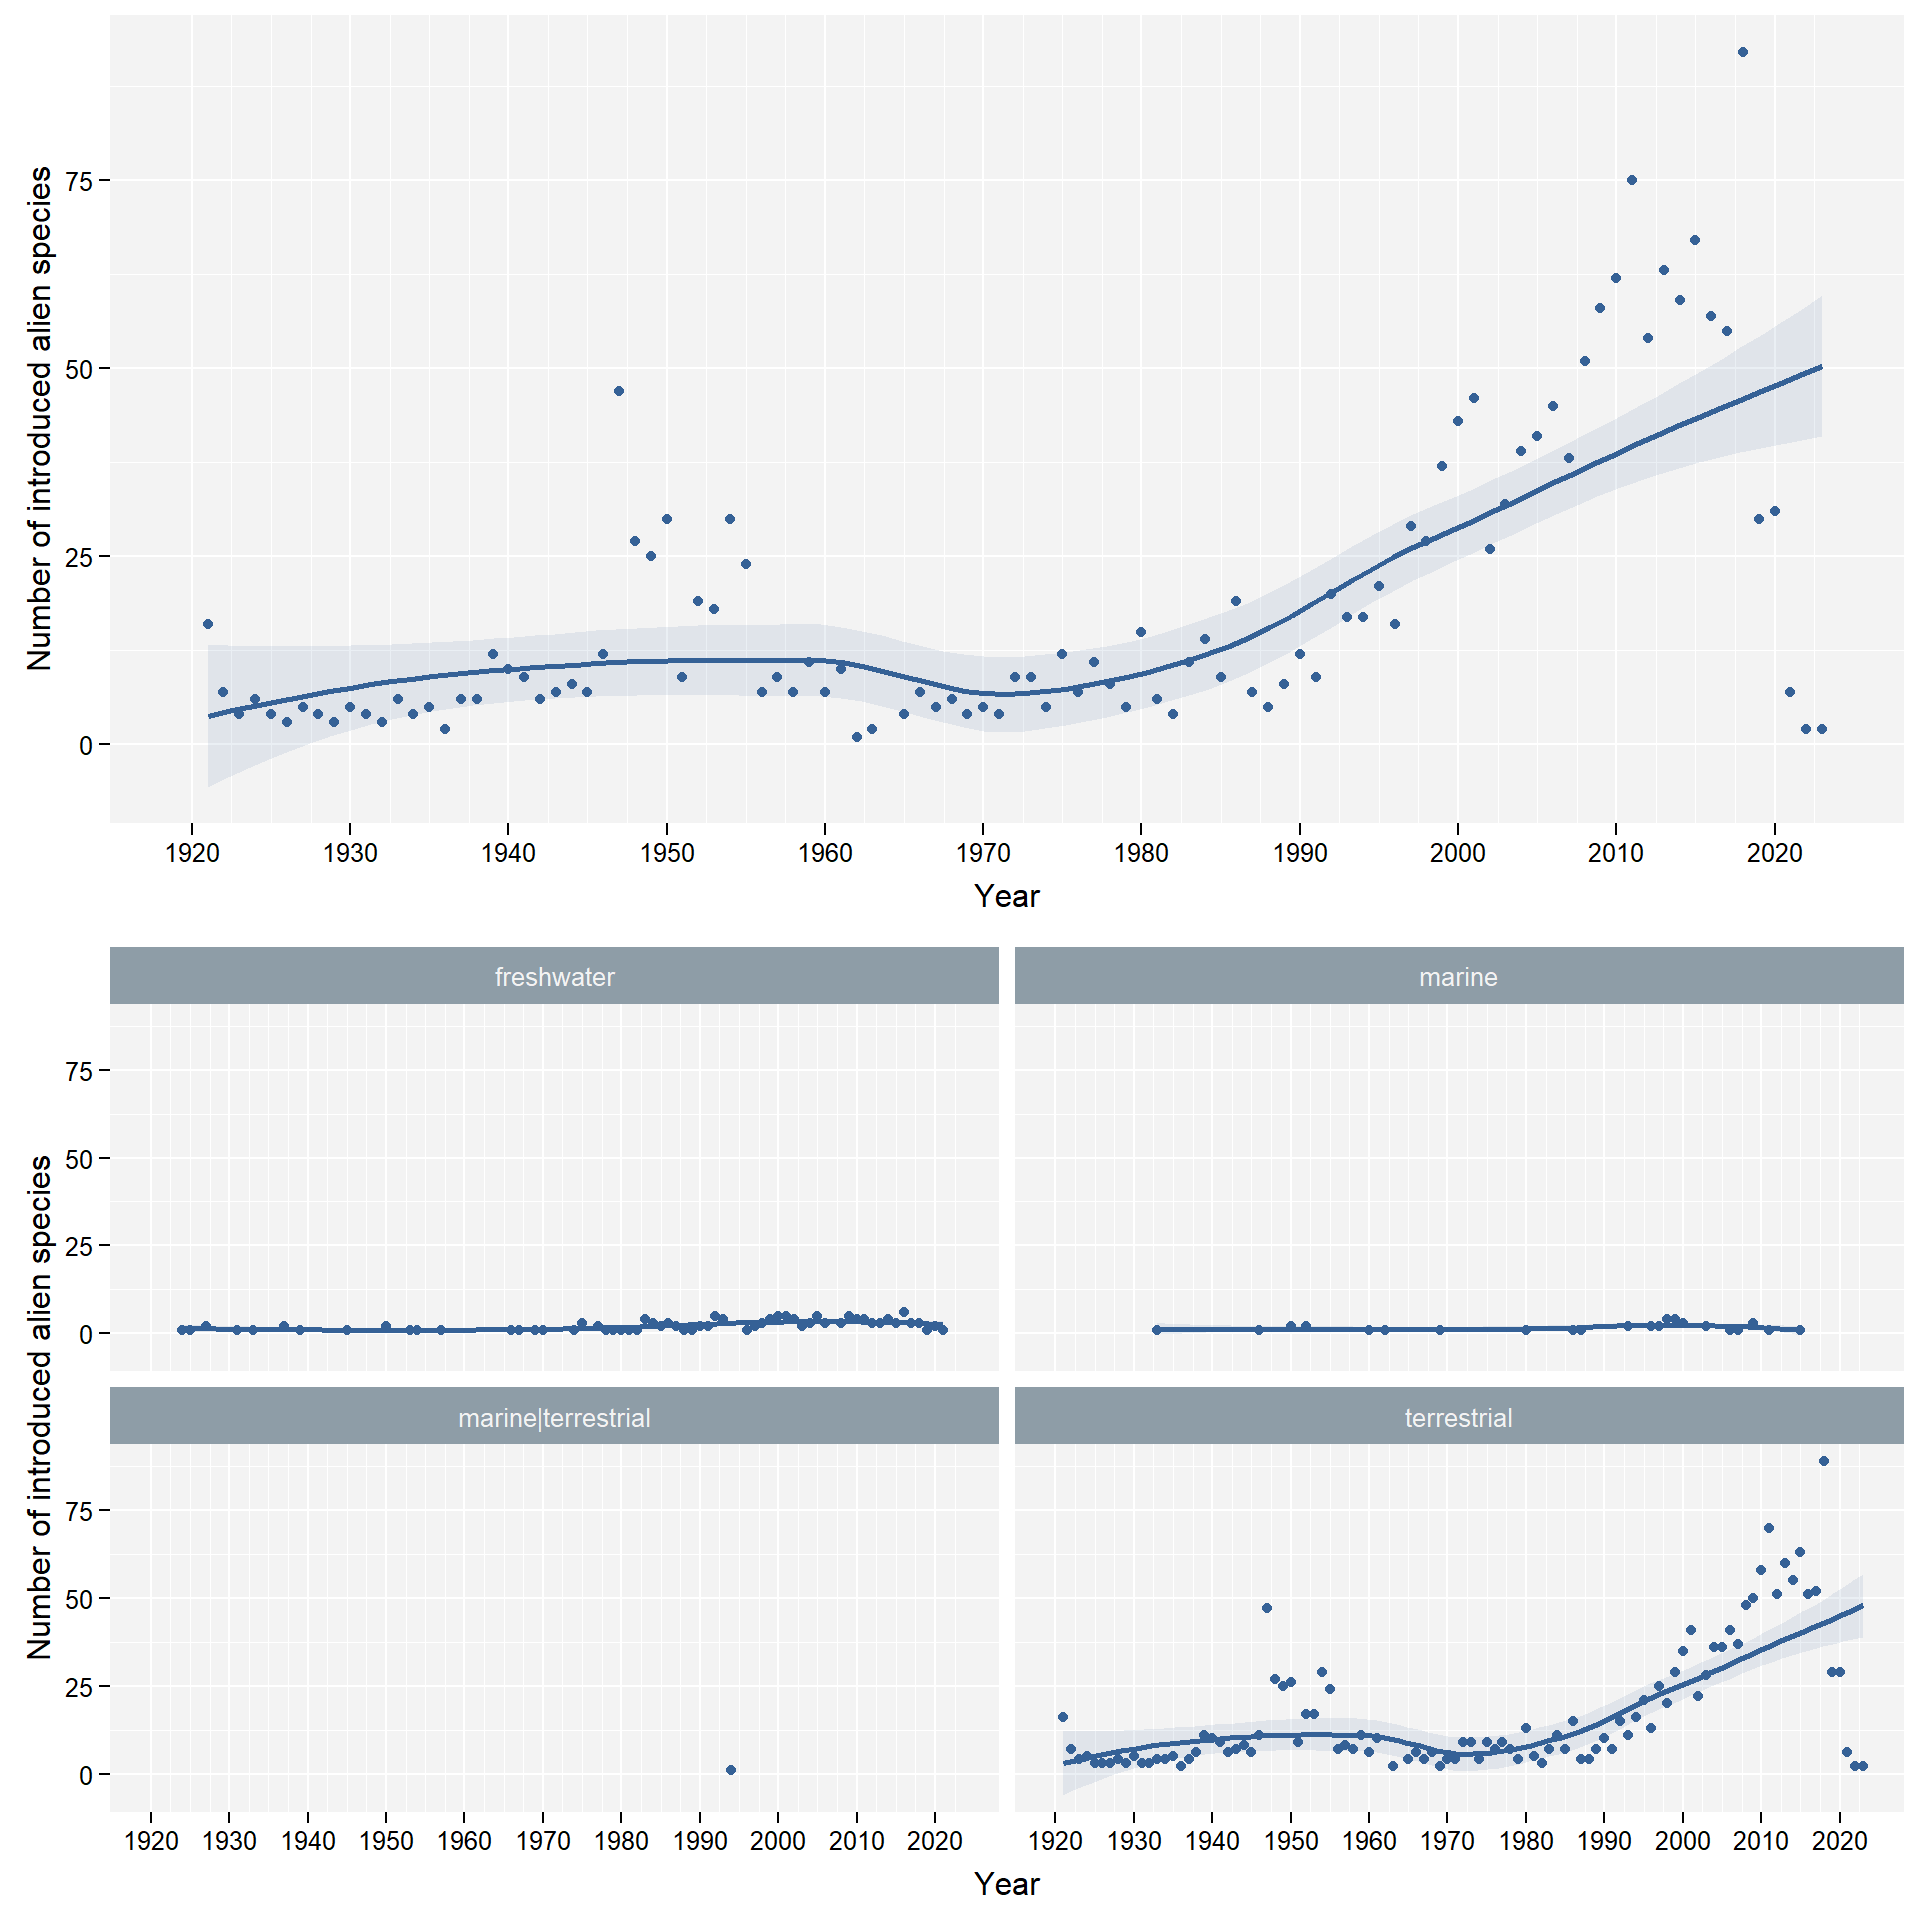
3.3 Grouping by species profile
We group data by habitat:
facet_column <- "habitat"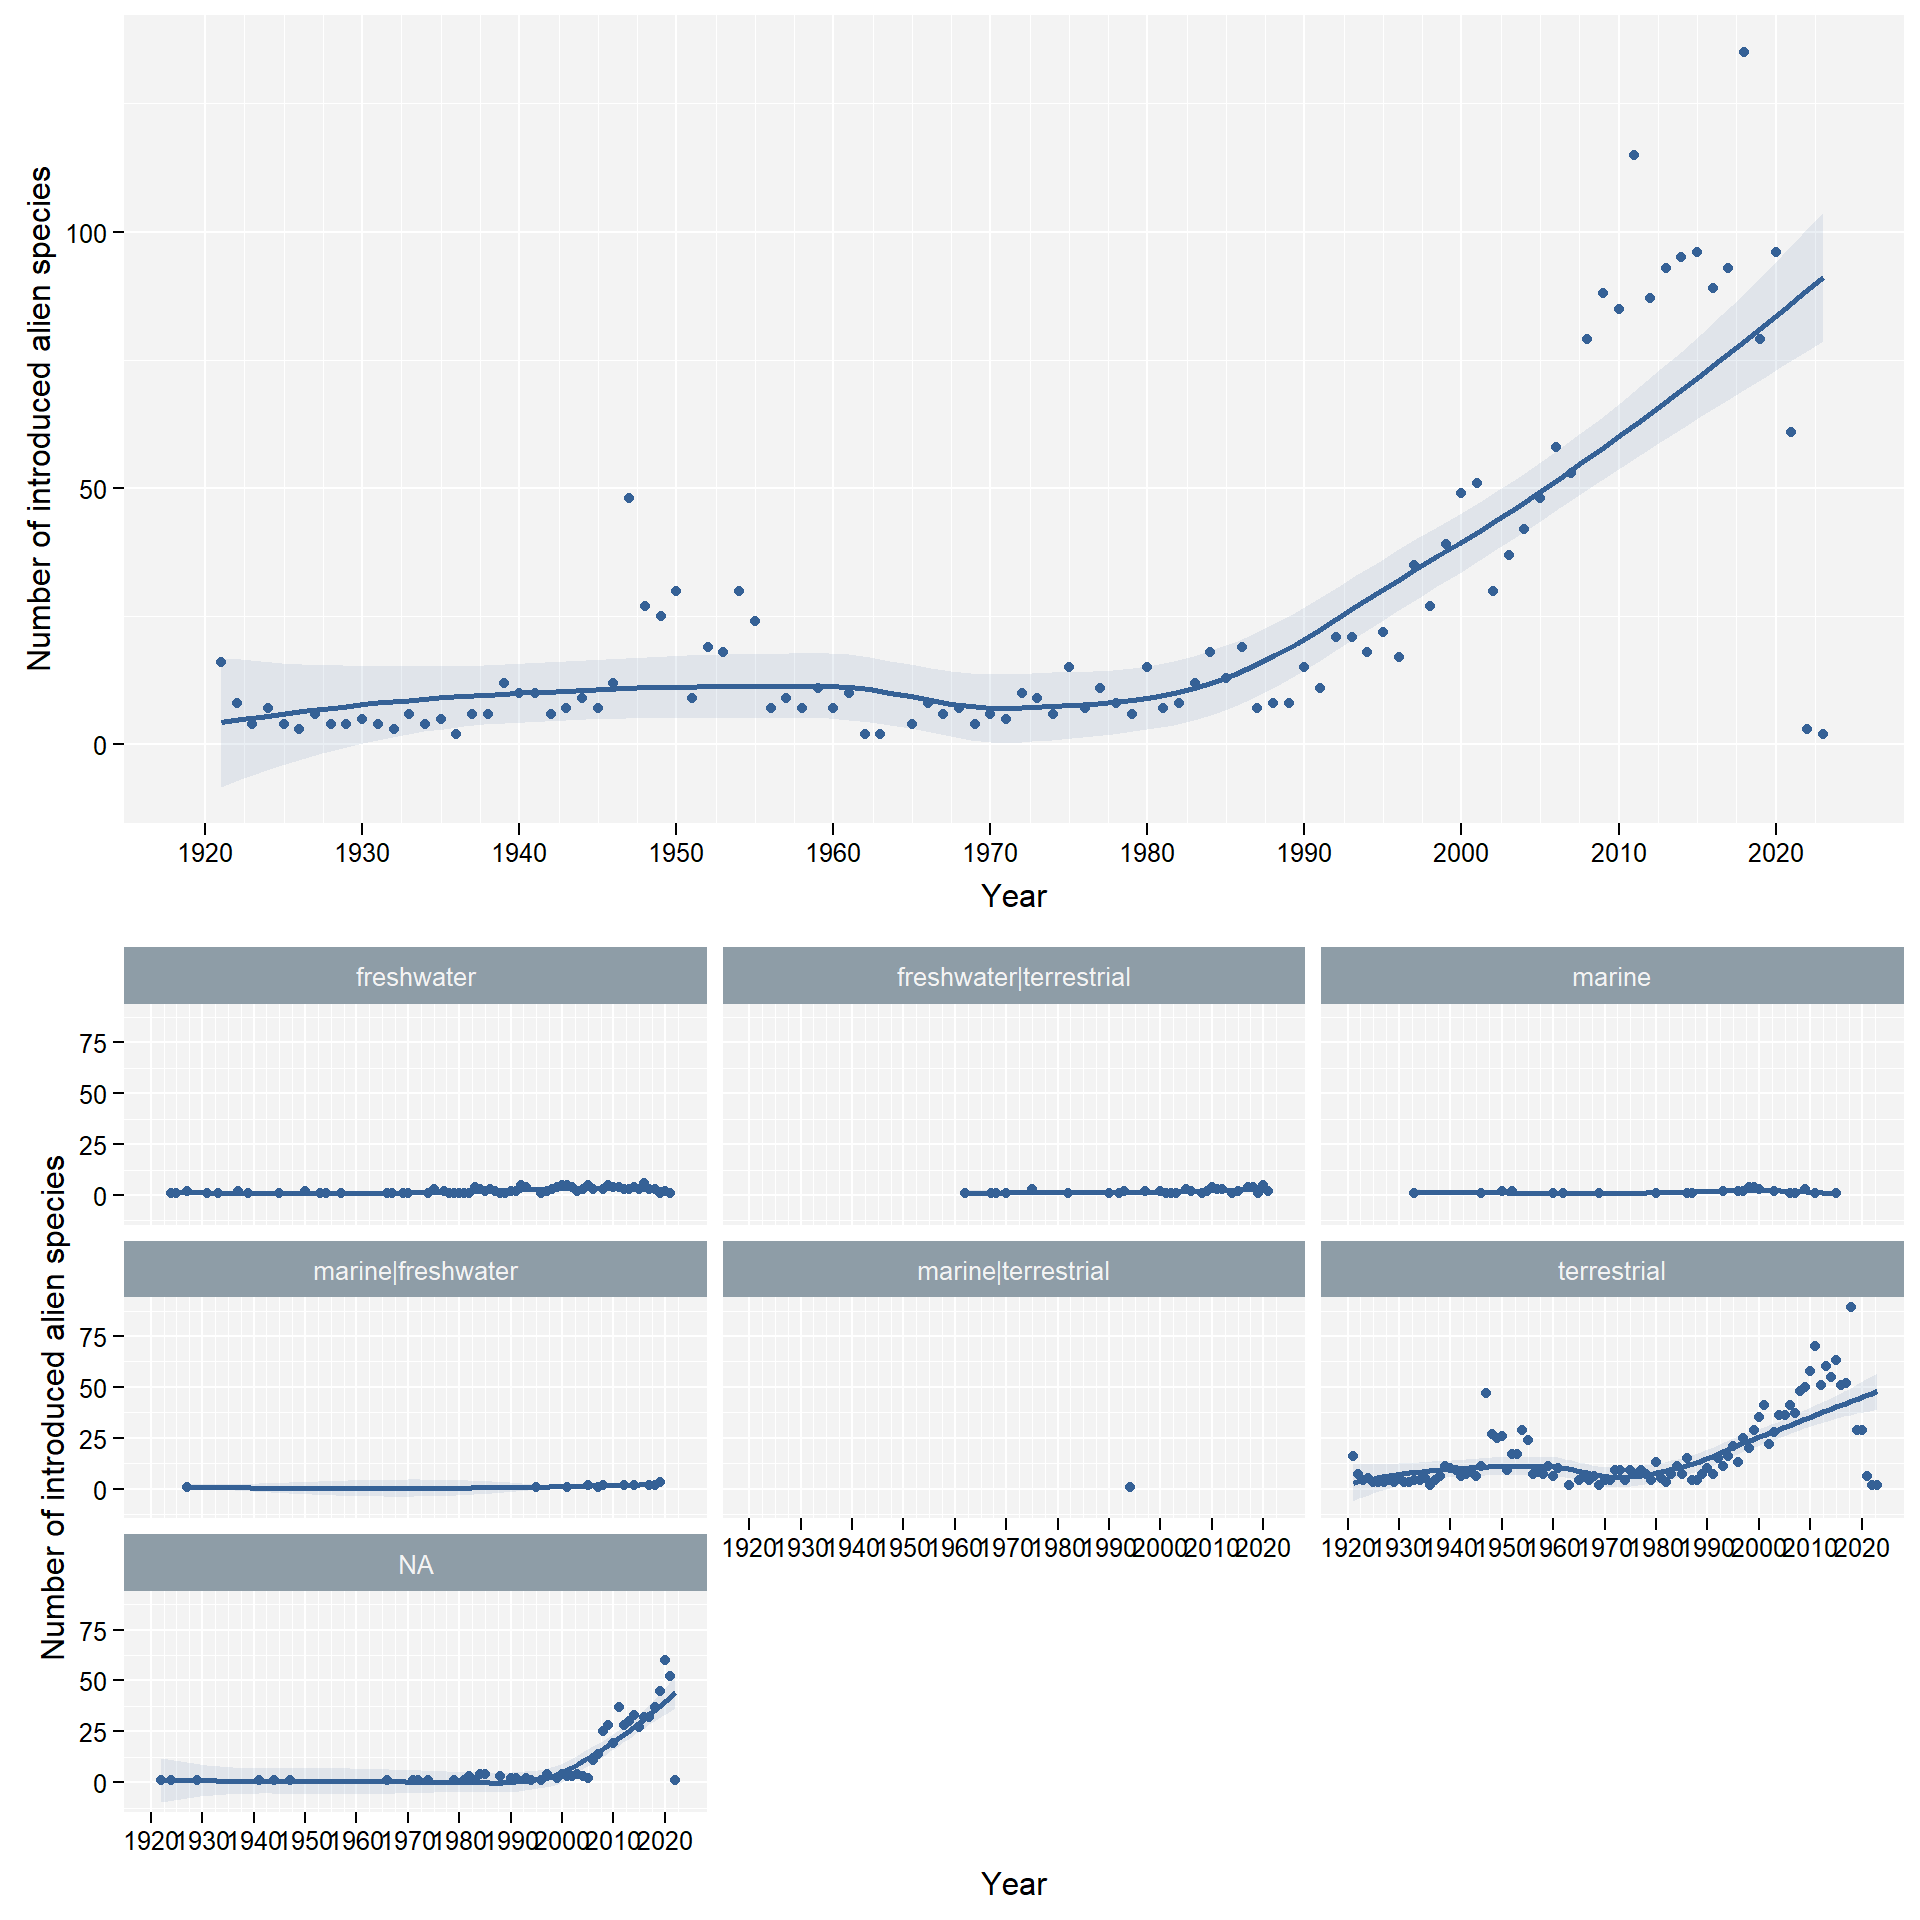
4 Checklist indicators for Living Planet Index
In this section we make little changes to the indicator graphs for publication on the Living Planet Index.
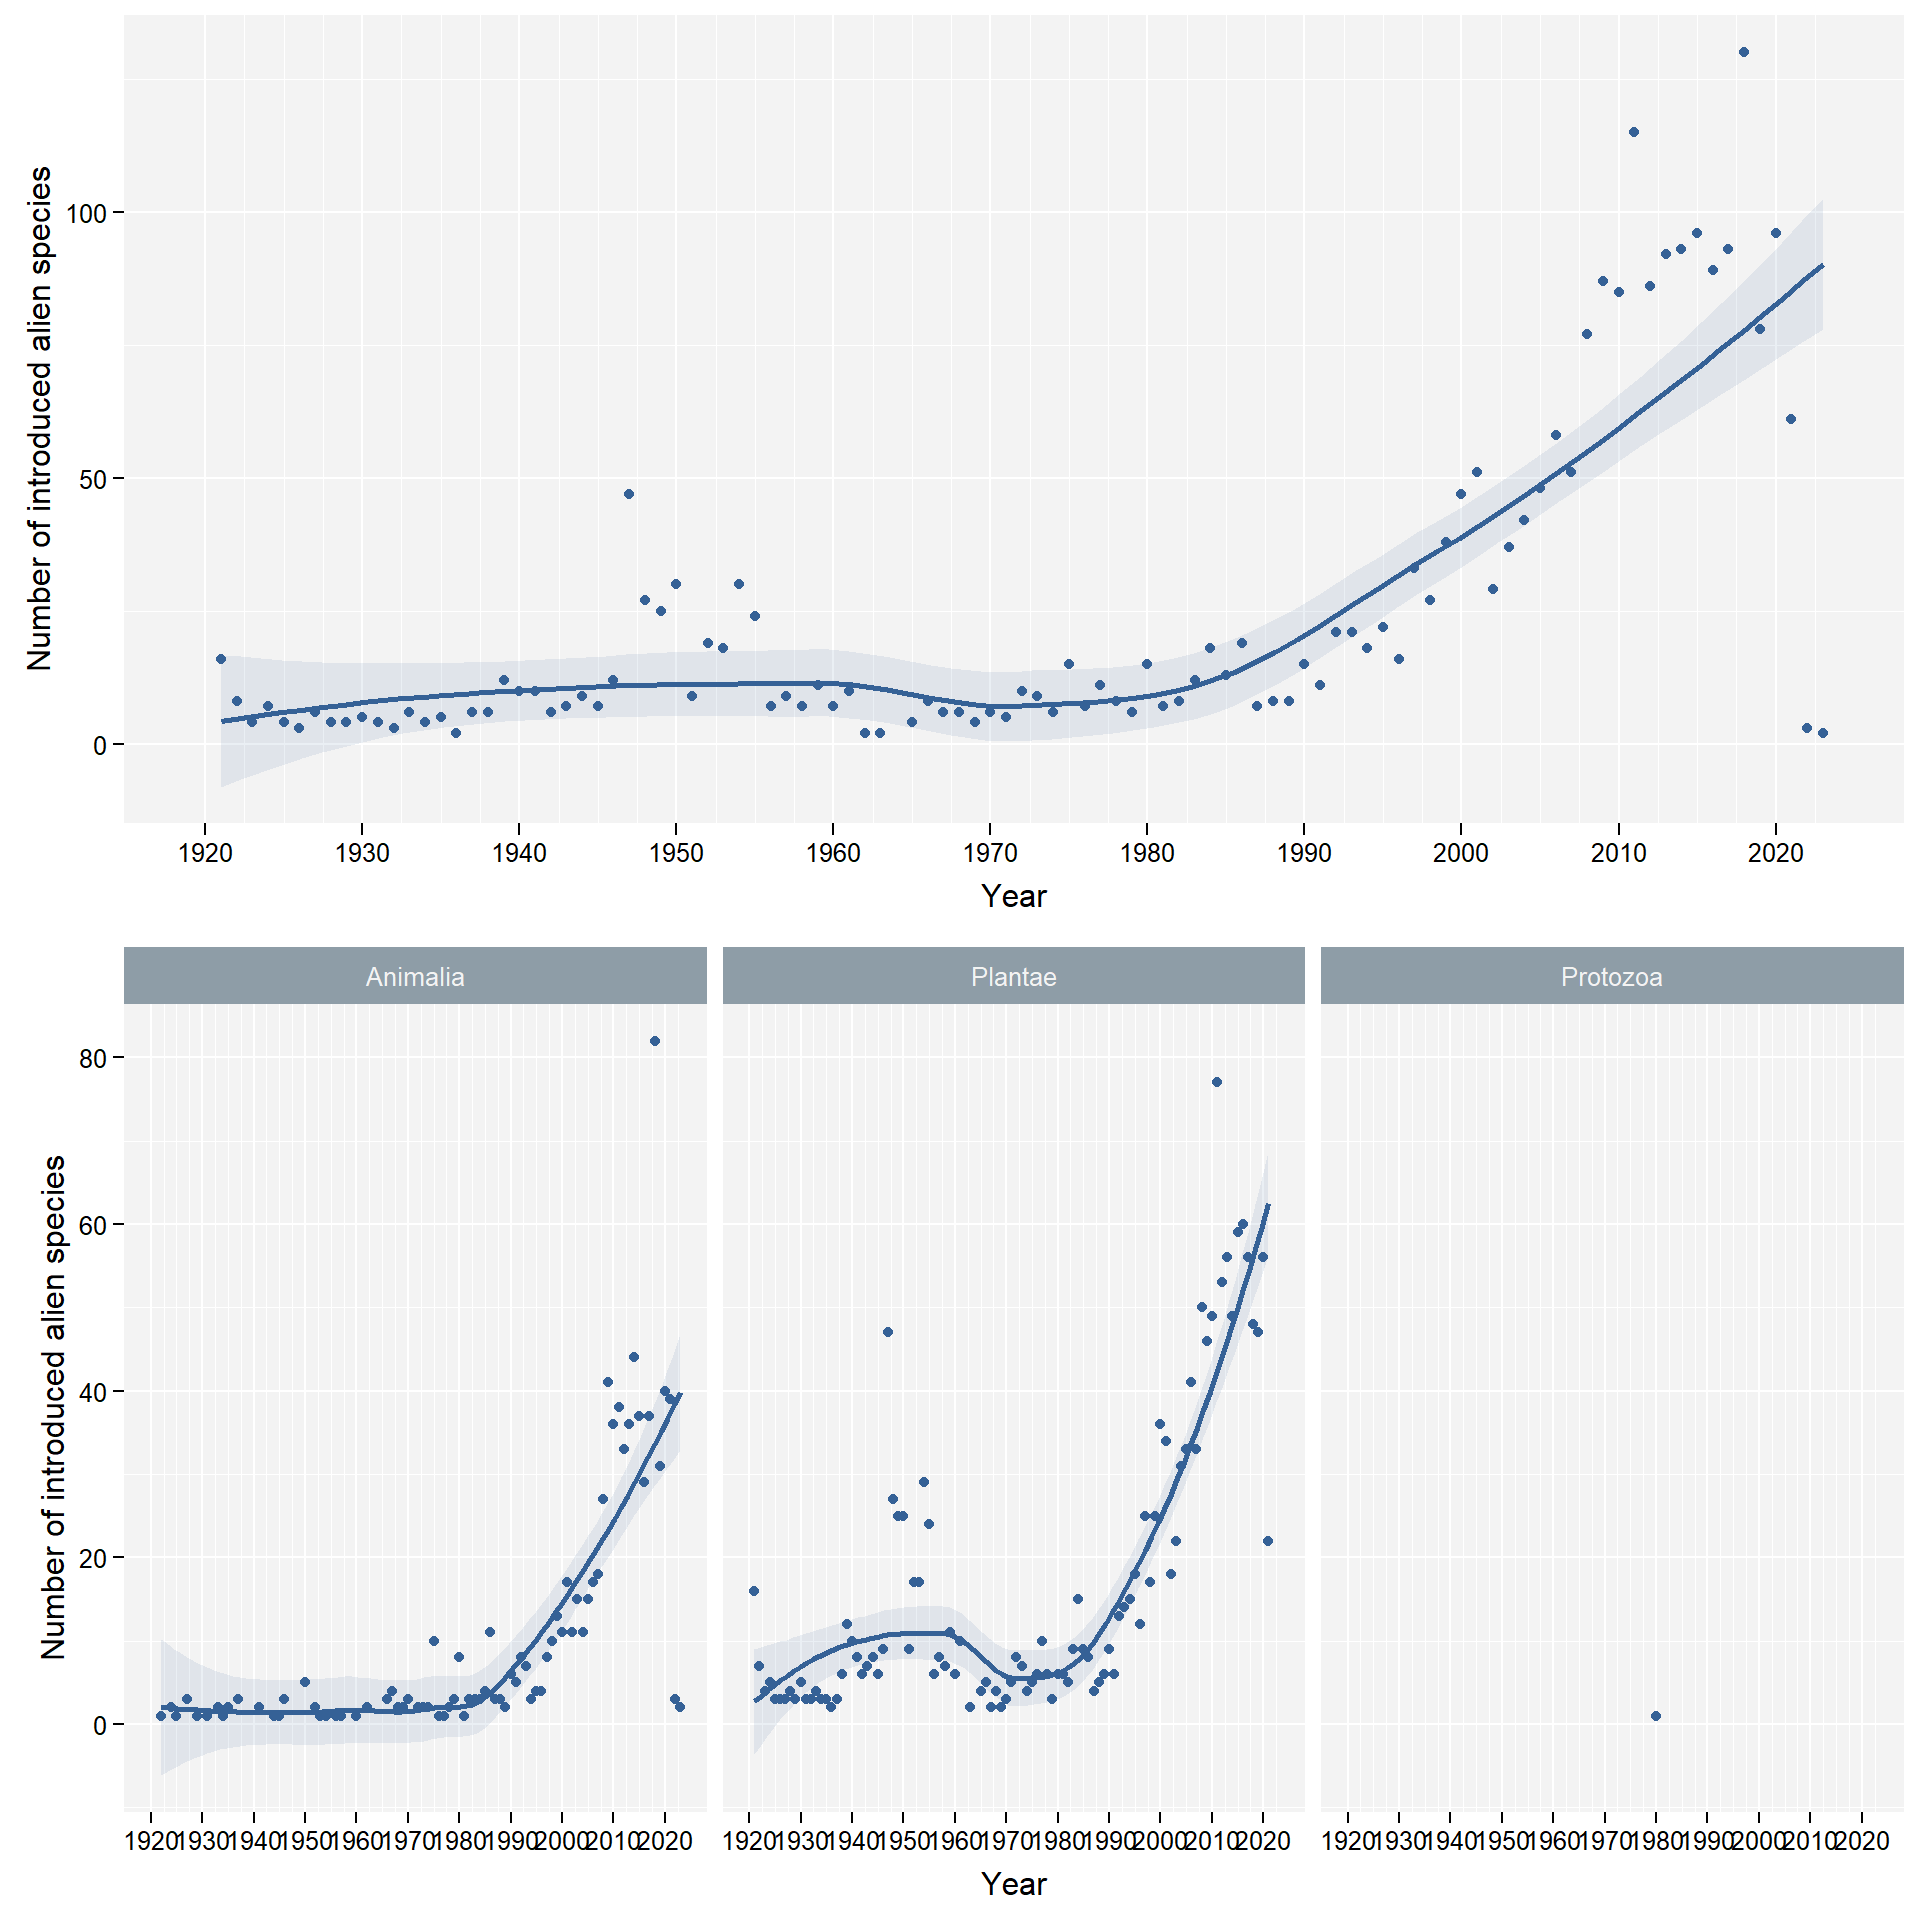
4.1 Grouping by kingdom
We group data by kingdom:
facet_column <- "kingdom"We don’t take into account Fungi and Chromista due to a lack of comprehensive data on those kingdoms:
4.2 Grouping by species profile
facet_column <- "habitat"We don’t take into account combined habitats
freshwater|terrestrial and marine|freshwater
due to a lack of comprehensive data on those habitats: