Taxonomic distribution of emerging species
Damiano Oldoni
Tim Adriaens
2024-07-03
This document follows the ranking pipeline to produce summary tables and graphs about the taxonomic distribution of the species defined as emerging (emerging status = 3).
1 Setup
Load libraries:
library(tidyverse) # To do data science
library(tidylog) # To provide feedback on dplyr functions
library(here) # To find files
2 Get data
Read the tab separated files containing the emerging status output:
em_df <- readr::read_tsv(
  here::here(
    "data",
    "output",
    "ranking_emerging_status_hierarchical_strategy_Belgium.tsv"
  ),
  na = ""
)
Preview:
tidylog::slice_head(em_df, n = 10)3 Number of emerging species per class, year, location and variable
First, reshape the data:
emerging_df <-
  em_df %>%
  tidylog::pivot_longer(starts_with("year_"),
    names_to = "variable",
    values_to = "emerging_status"
  )
Preview:
tidylog::slice_head(emerging_df, n = 10)We calculate the number of emerging species
(emerging_status = 3) at class level for each combination
of:
- year
- variable: occupancy or number of occurrences
- area of interest: Belgium or protected areas
emerging_df <-
  emerging_df %>%
  tidylog::group_by(
    .data$class,
    .data$kingdom,
    .data$variable
  ) %>%
  tidylog::summarise(
    n_emerging = length(.data$emerging_status[.data$emerging_status == 3]),
    n_total = length(.data$emerging_status)
  )
Add year, variable and area of interest as columns:
emerging_df <-
  emerging_df %>%
  tidylog::mutate(
    year = stringr::str_extract(.data$variable, pattern = "\\d+"),
    area = stringr::str_extract(.data$variable, pattern = "Belgium$|natura2000$"),
    variable = stringr::str_extract(.data$variable,
      pattern = "occupancy|occs"
    )
  ) %>%
  tidylog::mutate(area = recode(.data$area, natura2000 = "Natura2000")) %>%
  tidylog::relocate(n_emerging, n_total, .after = last_col()) %>%
  tidylog::ungroup() %>%
  dplyr::arrange(.data$year, desc(.data$n_emerging))
Preview:
head(emerging_df, 20)Save this table as output file:
readr::write_tsv(
  emerging_df,
  here::here(
    "data",
    "output",
    "number_of_emerging_taxa_per_class.tsv"
  ),
  na = ""
)
4 Summaries and graphs
Kingdoms with emerging species:
kingdoms <- emerging_df %>% tidylog::distinct(.data$kingdom)
kingdoms
Classes with emerging species:
classes <- emerging_df %>% tidylog::distinct(.data$class, .data$kingdom)
classes
Distribution of classes at kingdom levels:
classes %>%
  tidylog::group_by(.data$kingdom) %>%
  tidylog::count() %>%
  dplyr::arrange(desc(.data$n))
4.1 Taxonomic distribution at kingdom level
Number of emerging species at kingdom level:
emerging_df_kingdom <-
  emerging_df %>%
  tidylog::group_by(.data$kingdom, .data$variable, .data$year, .data$area) %>%
  tidylog::summarise(
    n_emerging = sum(.data$n_emerging),
    n_total = sum(.data$n_total)
  ) %>%
  tidylog::ungroup() %>%
  tidylog::mutate(frac_emerging = .data$n_emerging / .data$n_total) %>%
  dplyr::arrange(.data$variable, .data$area, .data$year, .data$kingdom)
emerging_df_kingdom
Show the absolute distribution at kingdom level for each variable/area/year:
emerging_plot_kingdom <-
  ggplot2::ggplot(emerging_df_kingdom) +
  ggplot2::geom_col(aes(x = kingdom, y = n_emerging, fill = year),
    position = "dodge"
  ) +
  ggplot2::facet_grid(rows = vars(variable), cols = vars(area)) +
  ggplot2::theme(
    axis.text.x = ggplot2::element_text(
      angle = 315,
      hjust = 0,
      vjust = 1
    )
  )
emerging_plot_kingdom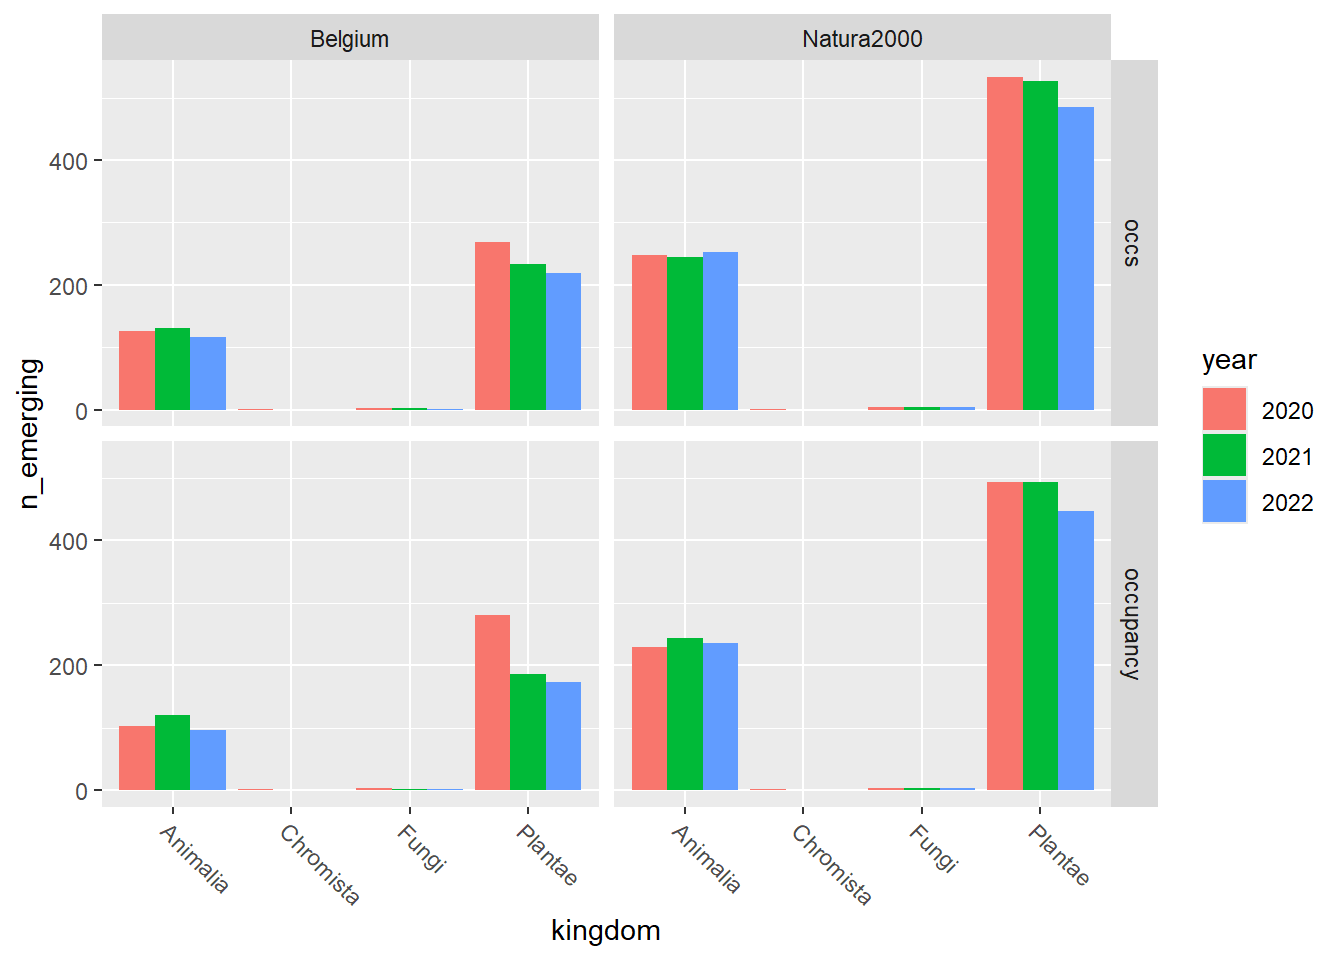
Show the relative distribution, i.e. the fraction number of emerging species / total number of alien species:
emerging_plot_kingdom_relative <-
  ggplot2::ggplot(emerging_df_kingdom) +
  ggplot2::geom_col(aes(x = kingdom, y = frac_emerging, fill = year),
    position = "dodge"
  ) +
  ggplot2::facet_grid(rows = vars(variable), cols = vars(area)) +
  ggplot2::theme(
    axis.text.x = ggplot2::element_text(
      angle = 315,
      hjust = 0,
      vjust = 1
    )
  )
emerging_plot_kingdom_relative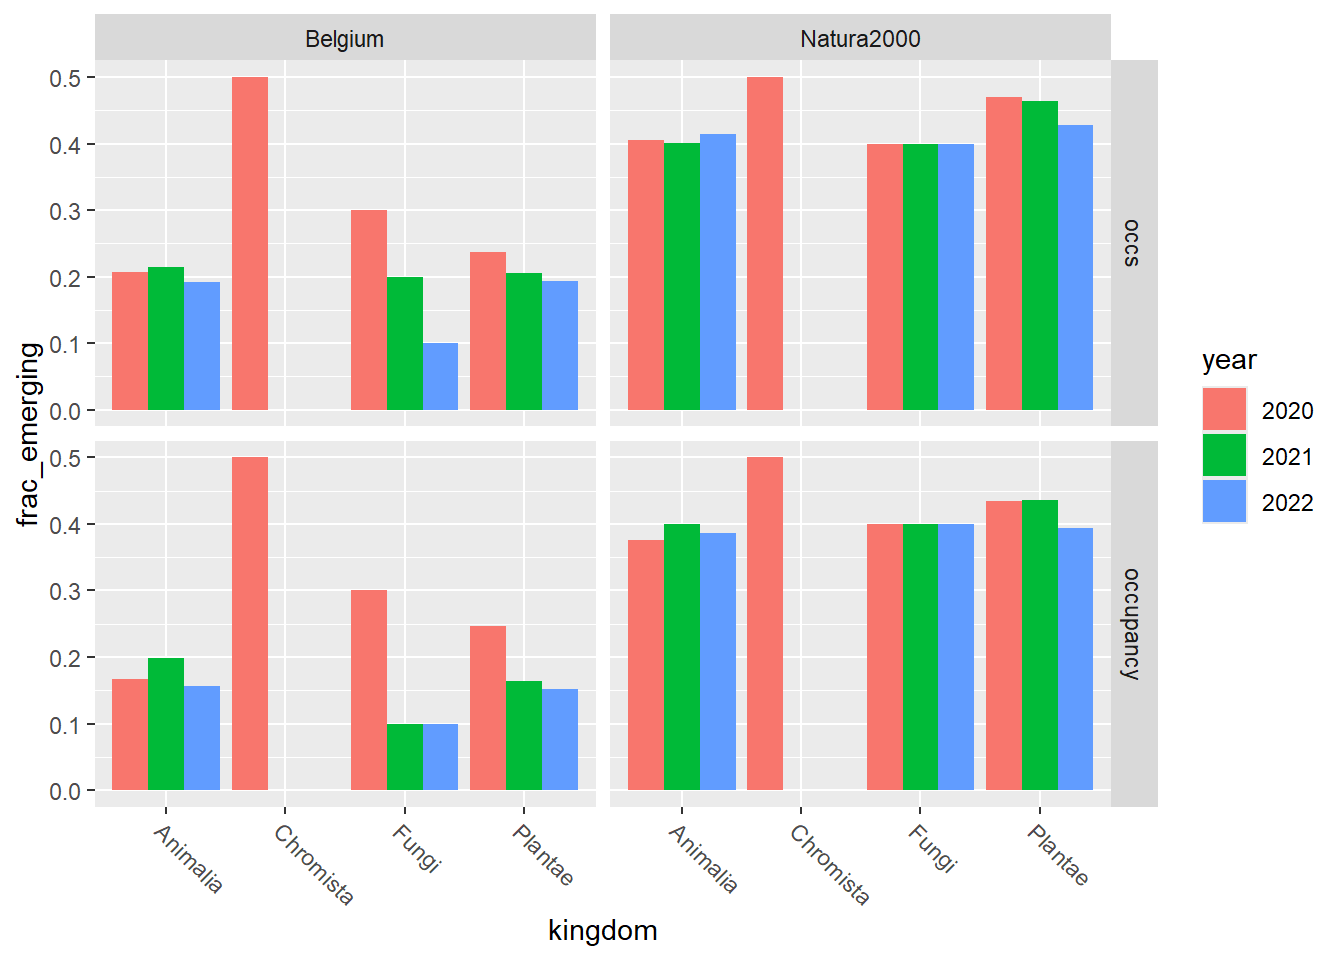
Save both the table emerging_df_kingdom and the graphs
with the absolute and relative distribution of emerging species at
kingdom level:
# save data.frame
readr::write_tsv(
  x = emerging_df_kingdom,
  file = here::here(
    "data",
    "output",
    "taxonomic_distribution_emerging_species",
    "number_of_emerging_taxa_per_kingdom.tsv"
  ),
  na = ""
)
# save plots with absolute distribution
ggplot2::ggsave(emerging_plot_kingdom,
  filename = here::here(
    "data",
    "output",
    "taxonomic_distribution_emerging_species",
    "n_emerging_taxa_per_kingdom.png"
  )
)
# save plots with relative distribution
ggplot2::ggsave(emerging_plot_kingdom_relative,
  filename = here::here(
    "data",
    "output",
    "taxonomic_distribution_emerging_species",
    "n_emerging_taxa_per_kingdom_relative.png"
  )
)
4.2 Taxonomic distribution at class level
4.2.1 Occupancy: Belgium
Table:
emerging_df_BE_occupancy <-
  emerging_df %>%
  tidylog::filter(.data$area == "Belgium" & .data$variable == "occupancy")
emerging_df_BE_occupancy
Graphs:
emerging_plots_BE_occupancy <- purrr::map(kingdoms$kingdom, function(x) {
  data <-
    emerging_df_BE_occupancy %>%
    tidylog::filter(.data$kingdom == x & .data$n_emerging > 0)
  ggplot2::ggplot(data) +
    ggplot2::geom_col(aes(x = class, y = n_emerging, fill = year),
      position = "dodge"
    ) +
    ggplot2::theme(
      axis.text.x = ggplot2::element_text(
        angle = 315,
        hjust = 0,
        vjust = 1
      )
    )
})
emerging_plots_BE_occupancy
## [[1]]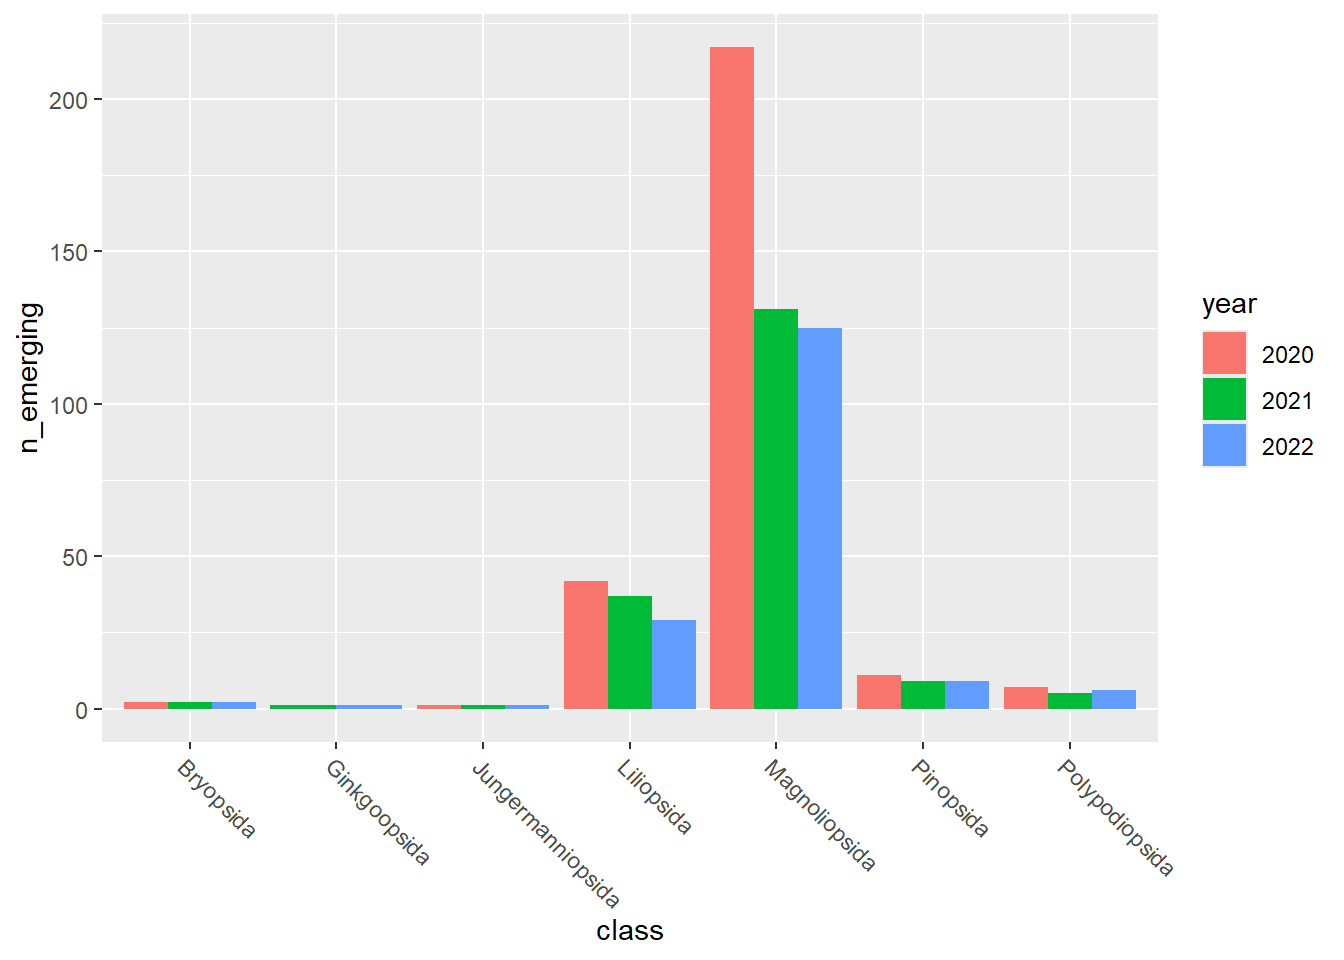
##
## [[2]]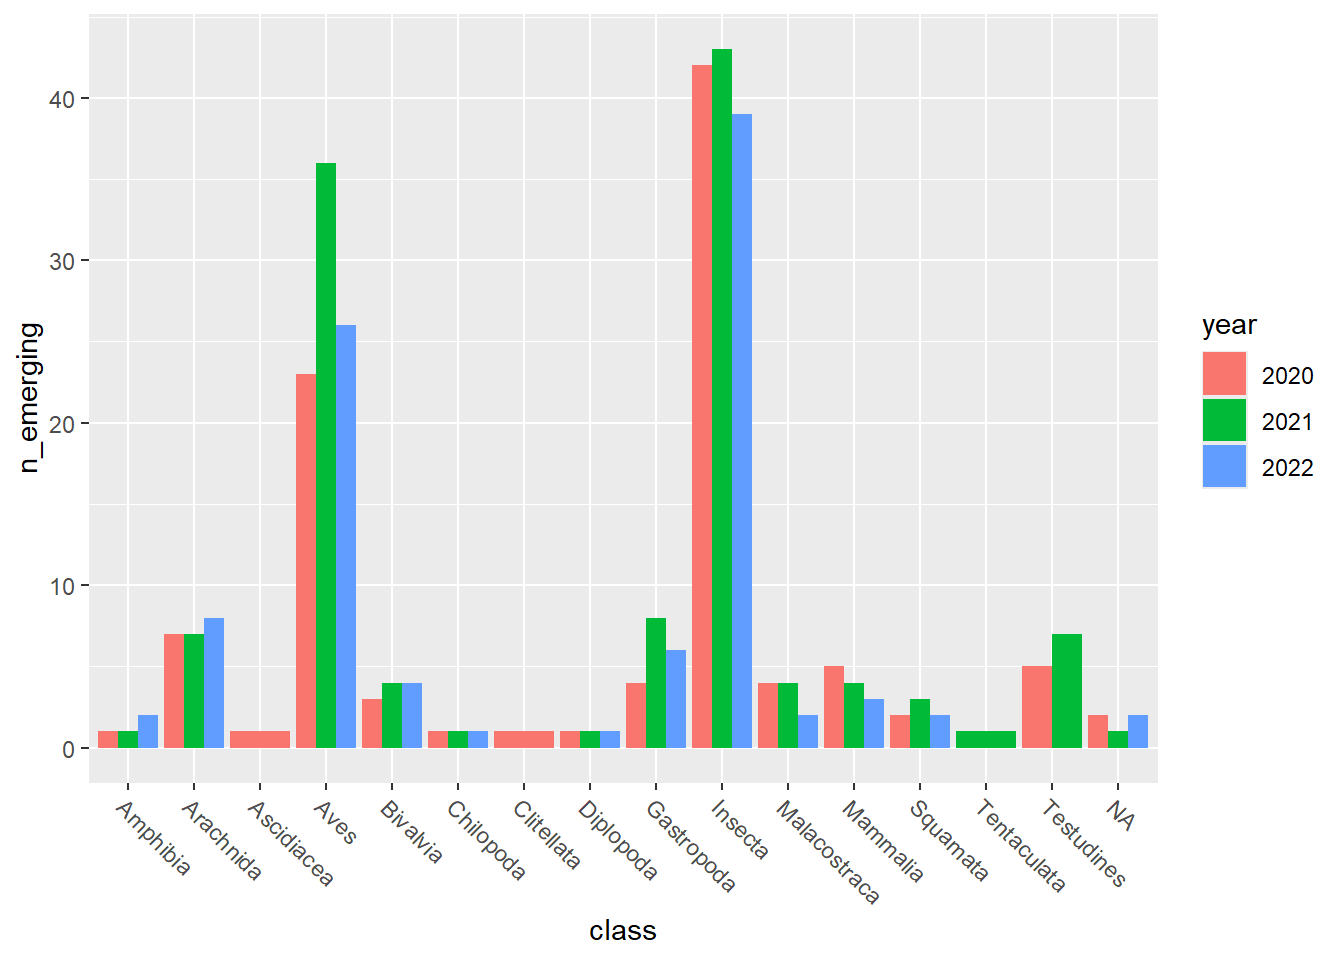
##
## [[3]]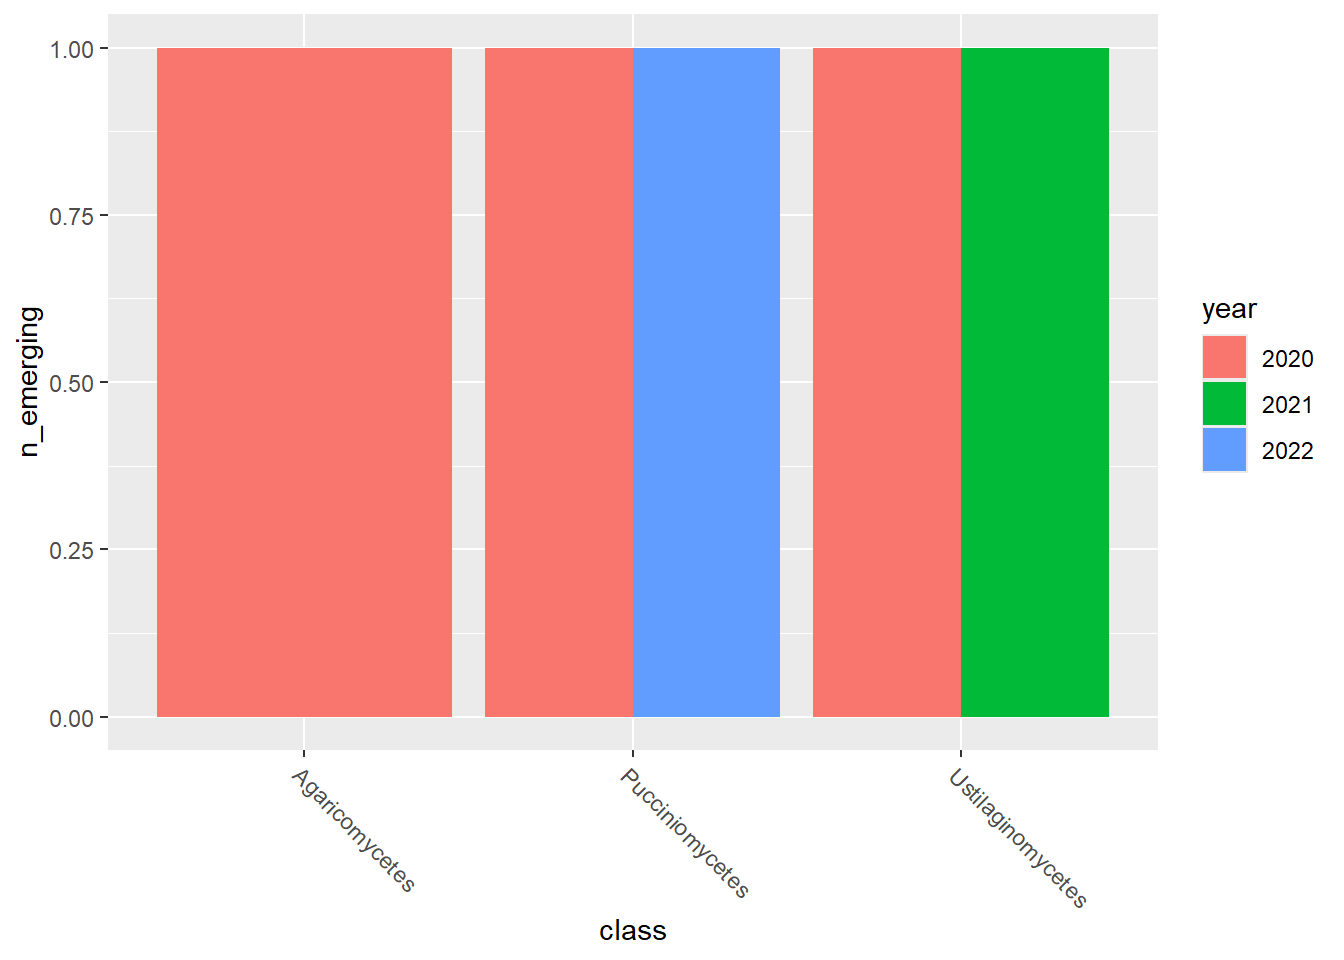
##
## [[4]]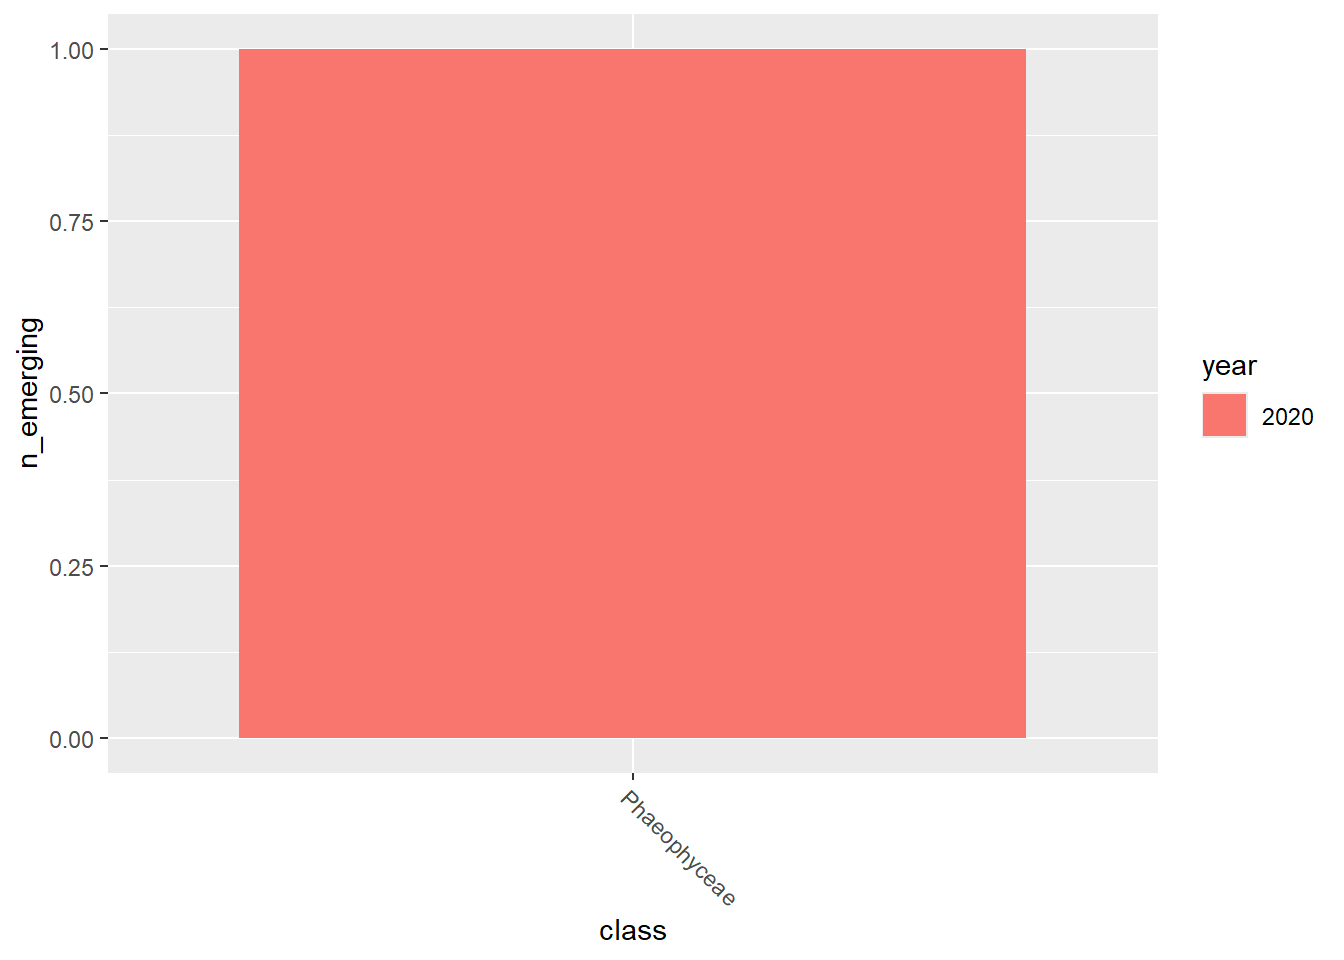
Save both table and graphs:
readr::write_tsv(
  emerging_df_BE_occupancy,
  here::here(
    "data",
    "output",
    "taxonomic_distribution_emerging_species",
    "n_emerging_taxa_per_class_in_BE_occupancy.tsv"
  ),
  na = ""
)
purrr::walk2(
  emerging_plots_BE_occupancy,
  kingdoms$kingdom,
  function(x, y) {
    ggplot2::ggsave(
      here::here(
        "data",
        "output",
        "taxonomic_distribution_emerging_species",
        paste0(
          "n_emerging_taxa_per_class_in_BE_occupancy_",
          y,
          ".png"
        )
      ),
      x
    )
  }
)
4.2.2 Occupancy: Natura2000
Table:
emerging_df_Natura2000_occupancy <-
  emerging_df %>%
  tidylog::filter(.data$area == "Natura2000" & .data$variable == "occupancy")
emerging_df_Natura2000_occupancy
Graphs:
emerging_plots_Natura2000_occupancy <- purrr::map(
  kingdoms$kingdom, function(x) {
    data <- emerging_df_Natura2000_occupancy %>%
      tidylog::filter(.data$kingdom == x & .data$n_emerging > 0)
    ggplot2::ggplot(data) +
      ggplot2::geom_col(aes(x = class, y = n_emerging, fill = year),
        position = "dodge"
      ) +
      ggplot2::theme(
        axis.text.x = ggplot2::element_text(
          angle = 315,
          hjust = 0,
          vjust = 1
        )
      )
  }
)
emerging_plots_Natura2000_occupancy
## [[1]]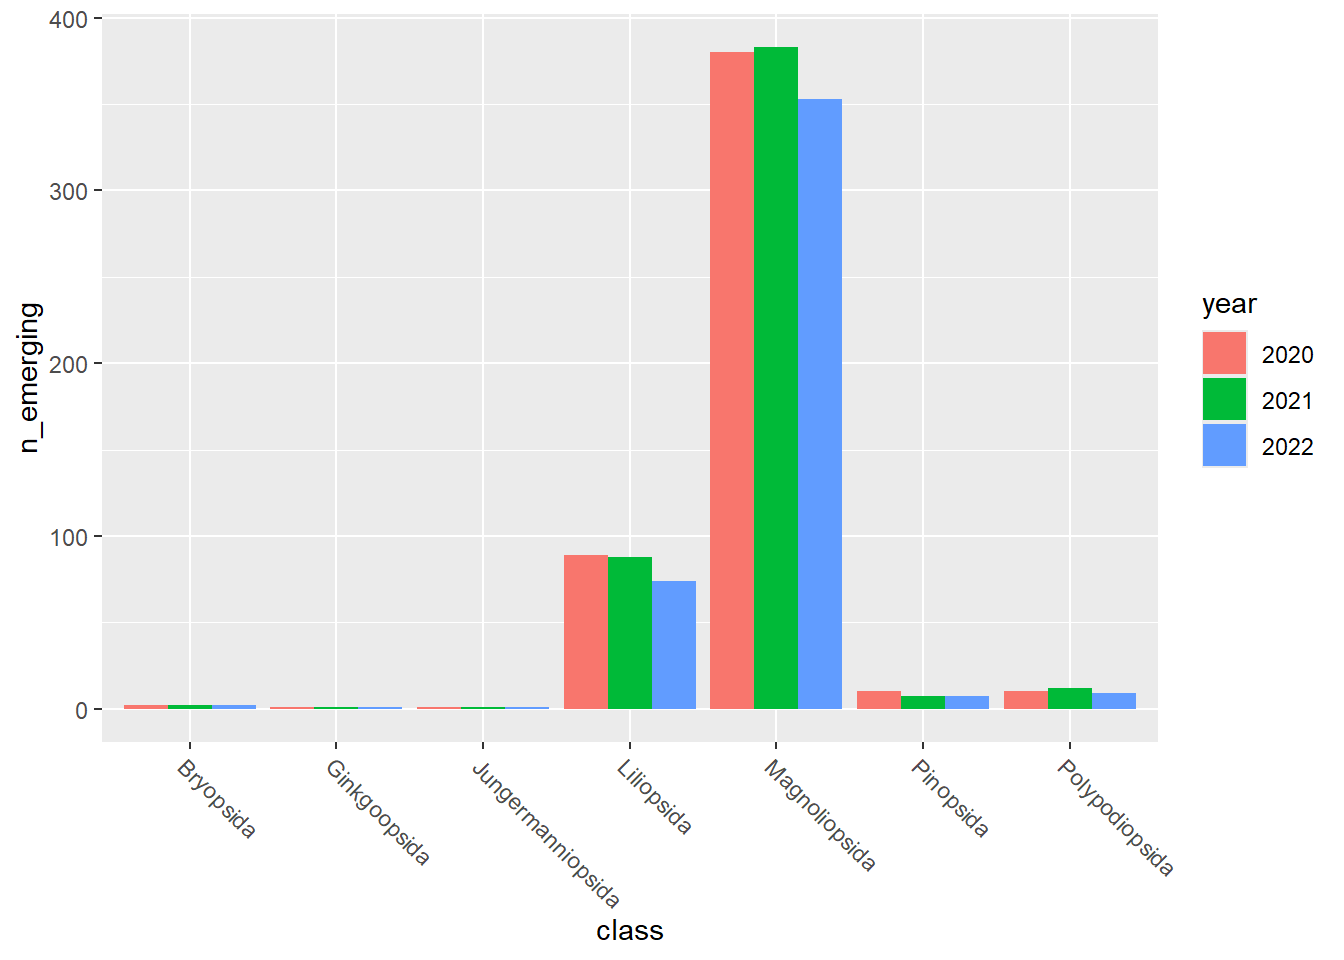
##
## [[2]]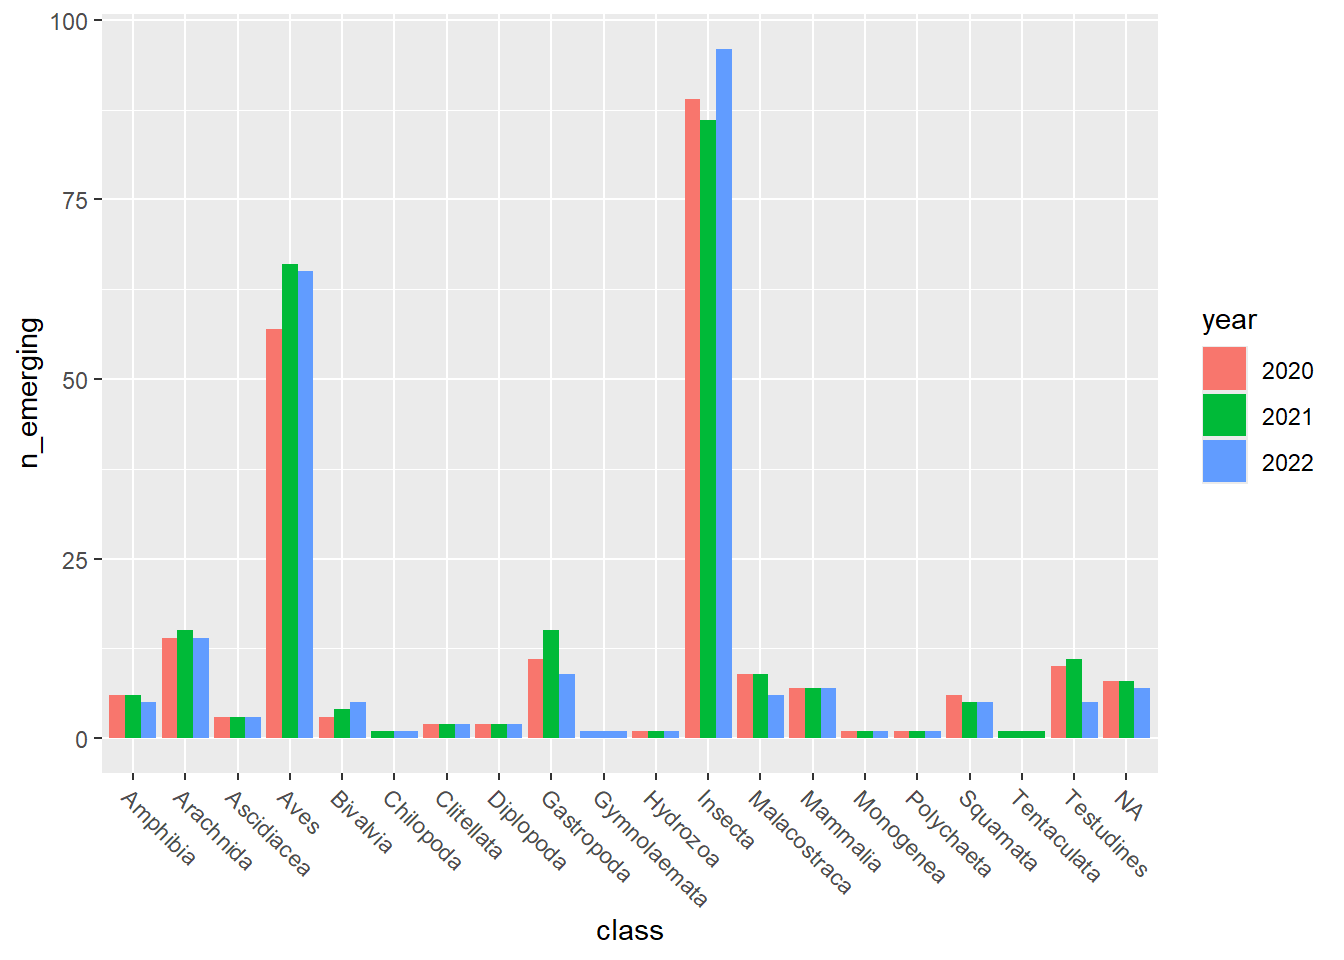
##
## [[3]]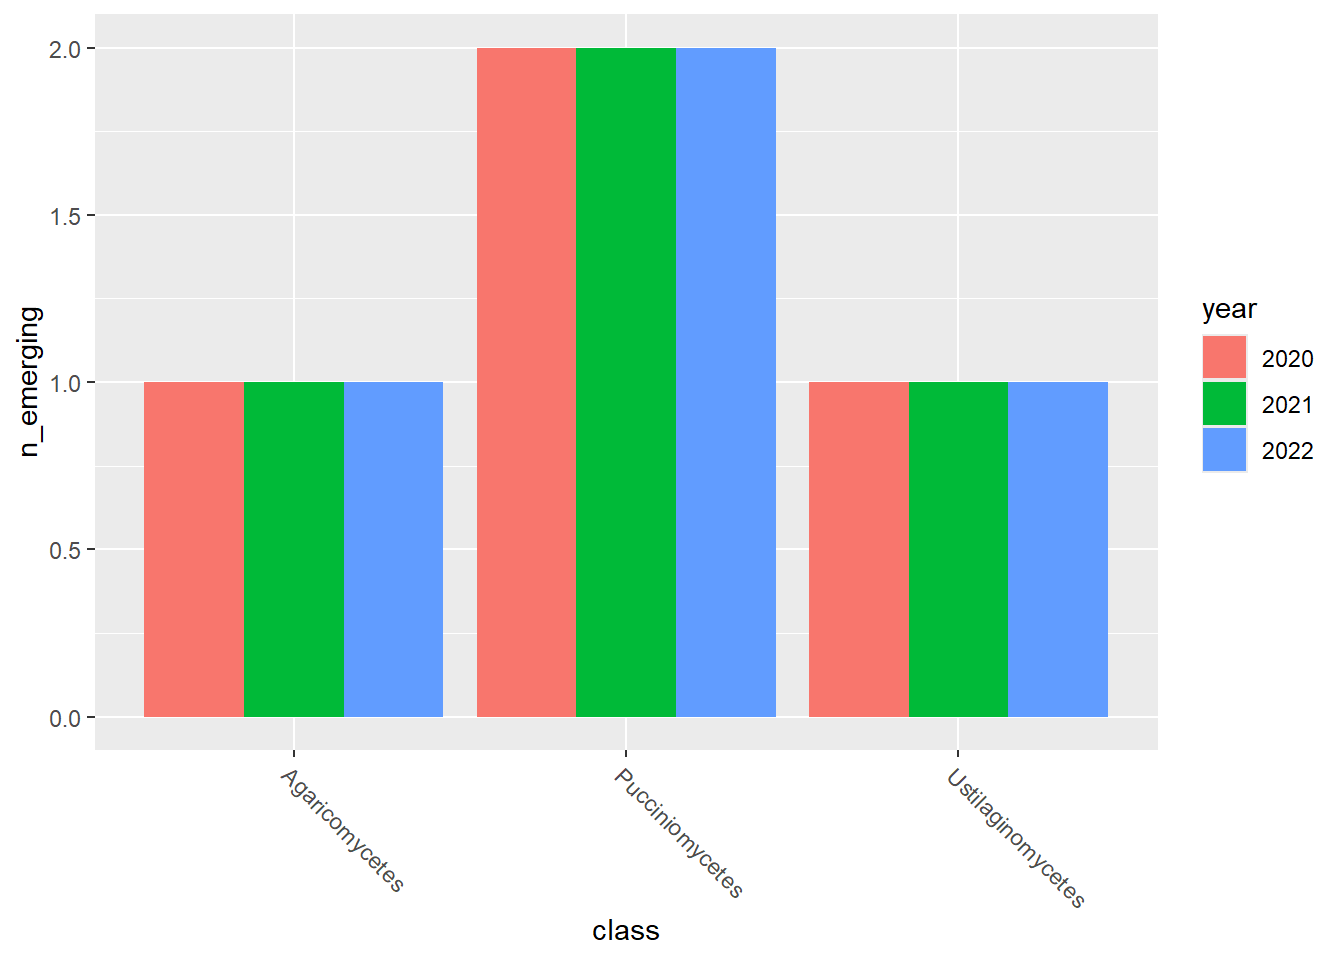
##
## [[4]]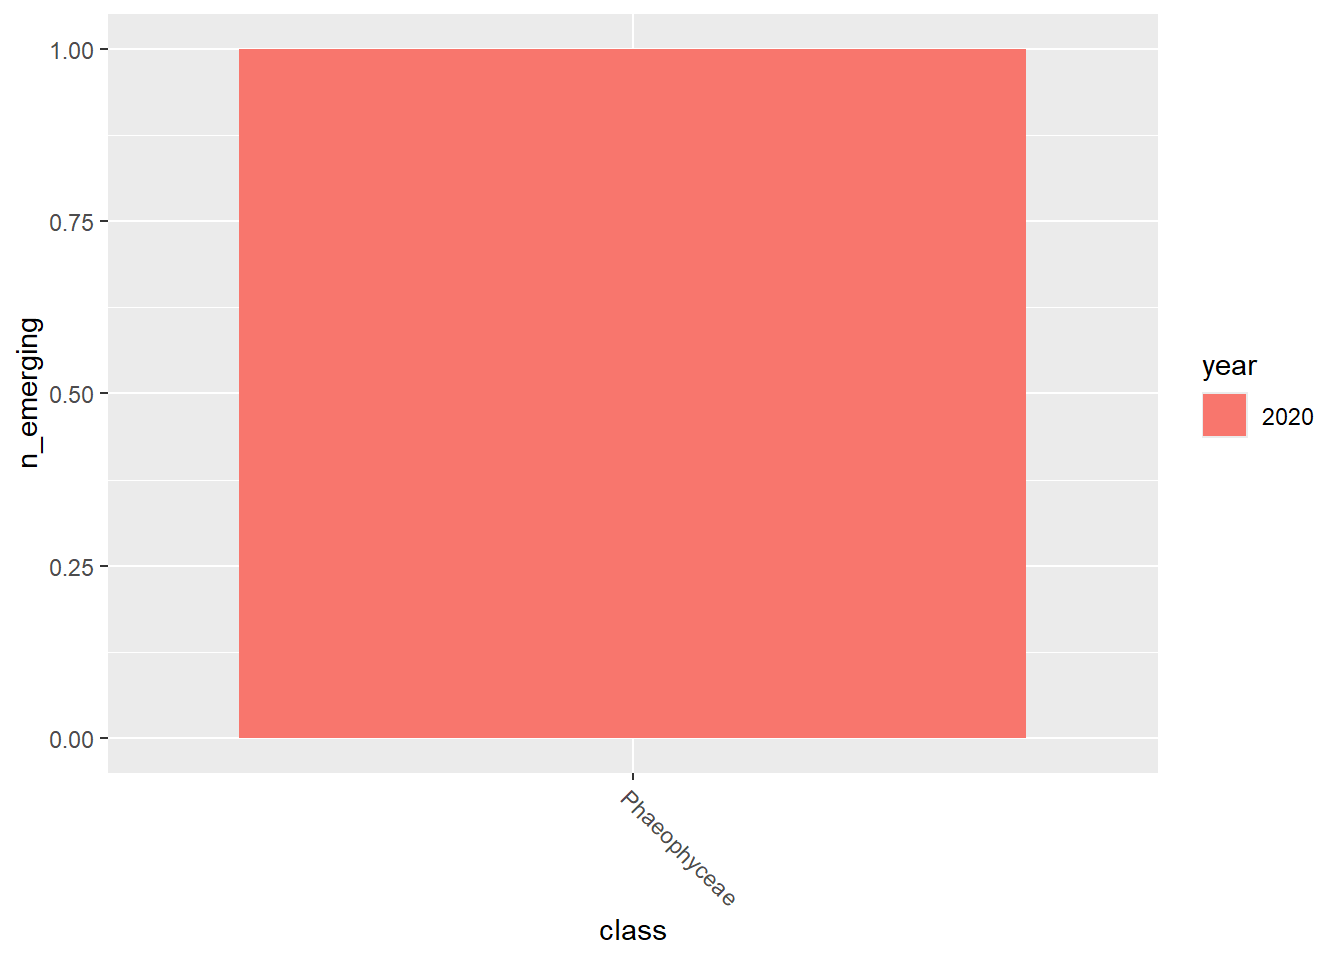
Save both table and graphs:
readr::write_tsv(
  emerging_df_Natura2000_occupancy,
  here::here(
    "data",
    "output",
    "taxonomic_distribution_emerging_species",
    "n_emerging_taxa_per_class_in_Natura2000_occupancy.tsv"
  ),
  na = ""
)
purrr::walk2(
  emerging_plots_Natura2000_occupancy,
  kingdoms$kingdom,
  function(x, y) {
    ggplot2::ggsave(
      here::here(
        "data",
        "output",
        "taxonomic_distribution_emerging_species",
        paste0(
          "n_emerging_taxa_per_class_in_Natura2000_occupancy_",
          y, ".png"
        )
      ),
      x
    )
  }
)
4.2.3 Number of occurrences: Belgium
Table:
emerging_df_BE_occs <-
  emerging_df %>%
  tidylog::filter(.data$area == "Belgium" & .data$variable == "occs")
emerging_df_BE_occs
Graphs:
emerging_plots_BE_occs <- purrr::map(kingdoms$kingdom, function(x) {
  data <- emerging_df_BE_occs %>%
    tidylog::filter(.data$kingdom == x & .data$n_emerging > 0)
  ggplot2::ggplot(data) +
    ggplot2::geom_col(aes(x = class, y = n_emerging, fill = year),
      position = "dodge"
    ) +
    ggplot2::theme(
      axis.text.x = ggplot2::element_text(
        angle = 315,
        hjust = 0,
        vjust = 1
      )
    )
})
emerging_plots_BE_occs
## [[1]]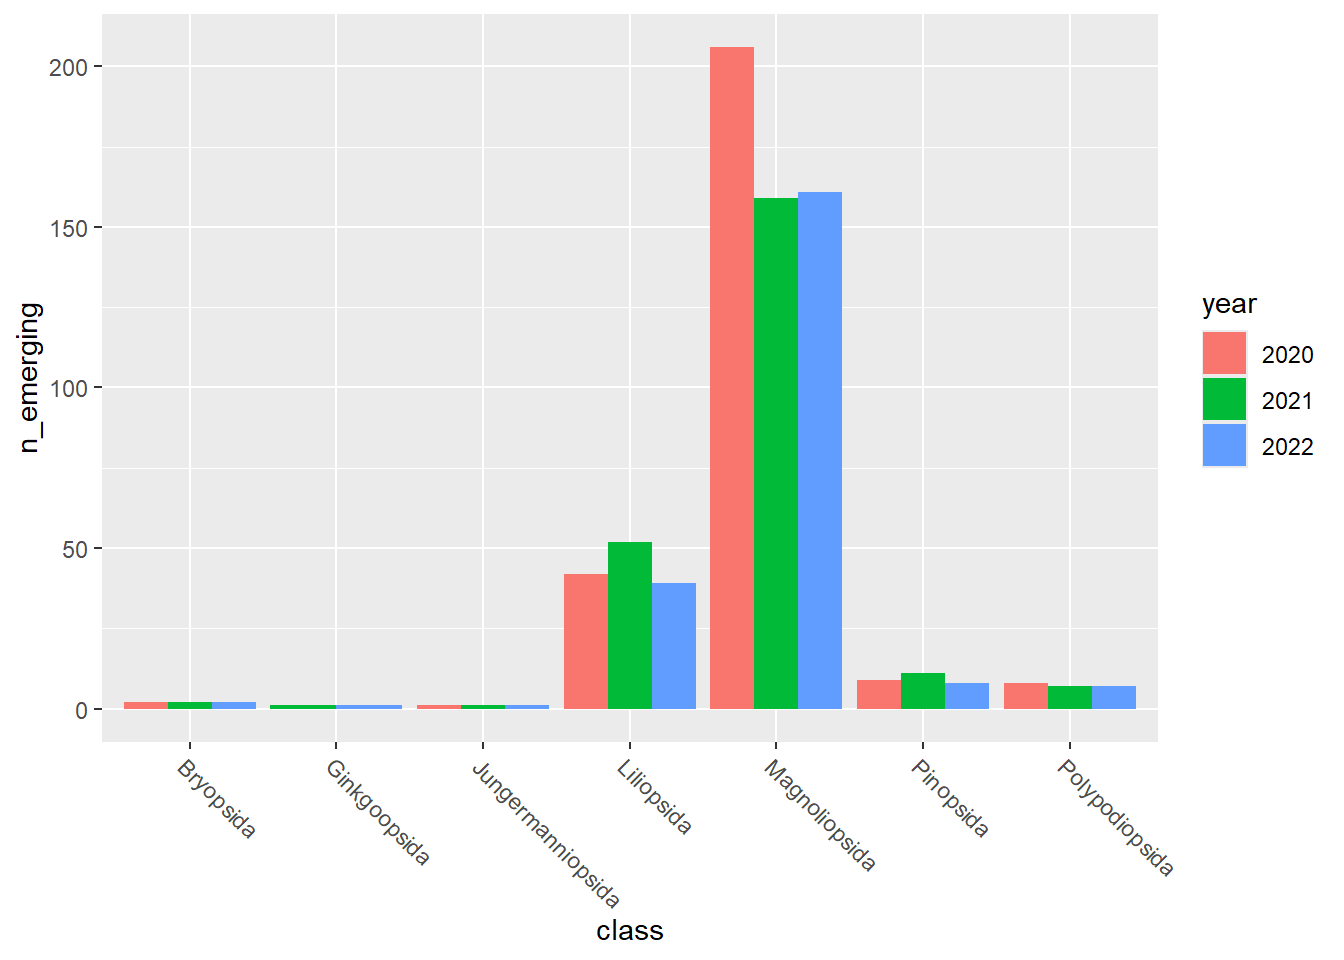
##
## [[2]]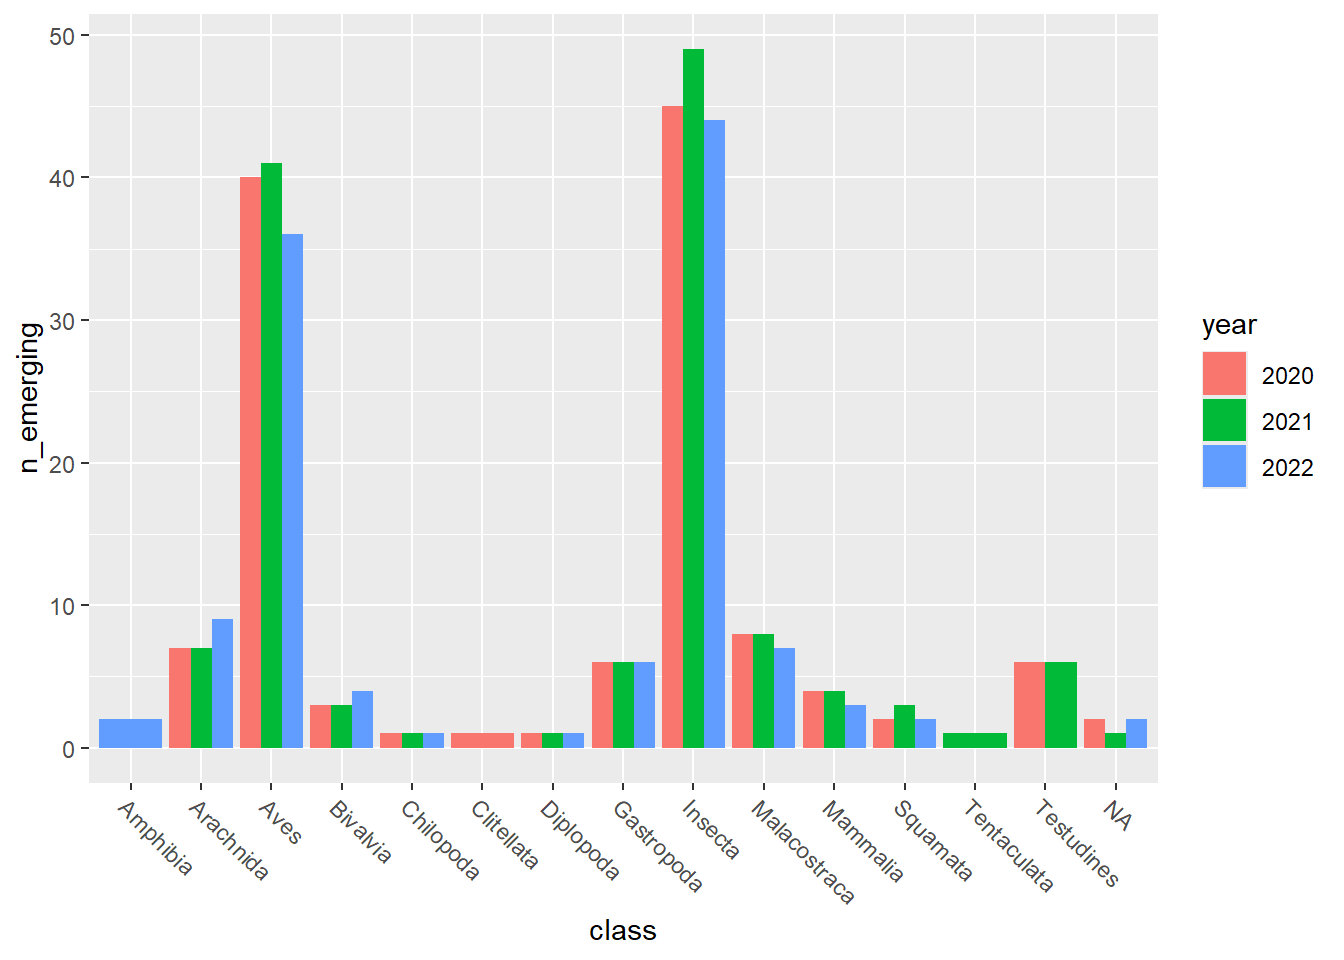
##
## [[3]]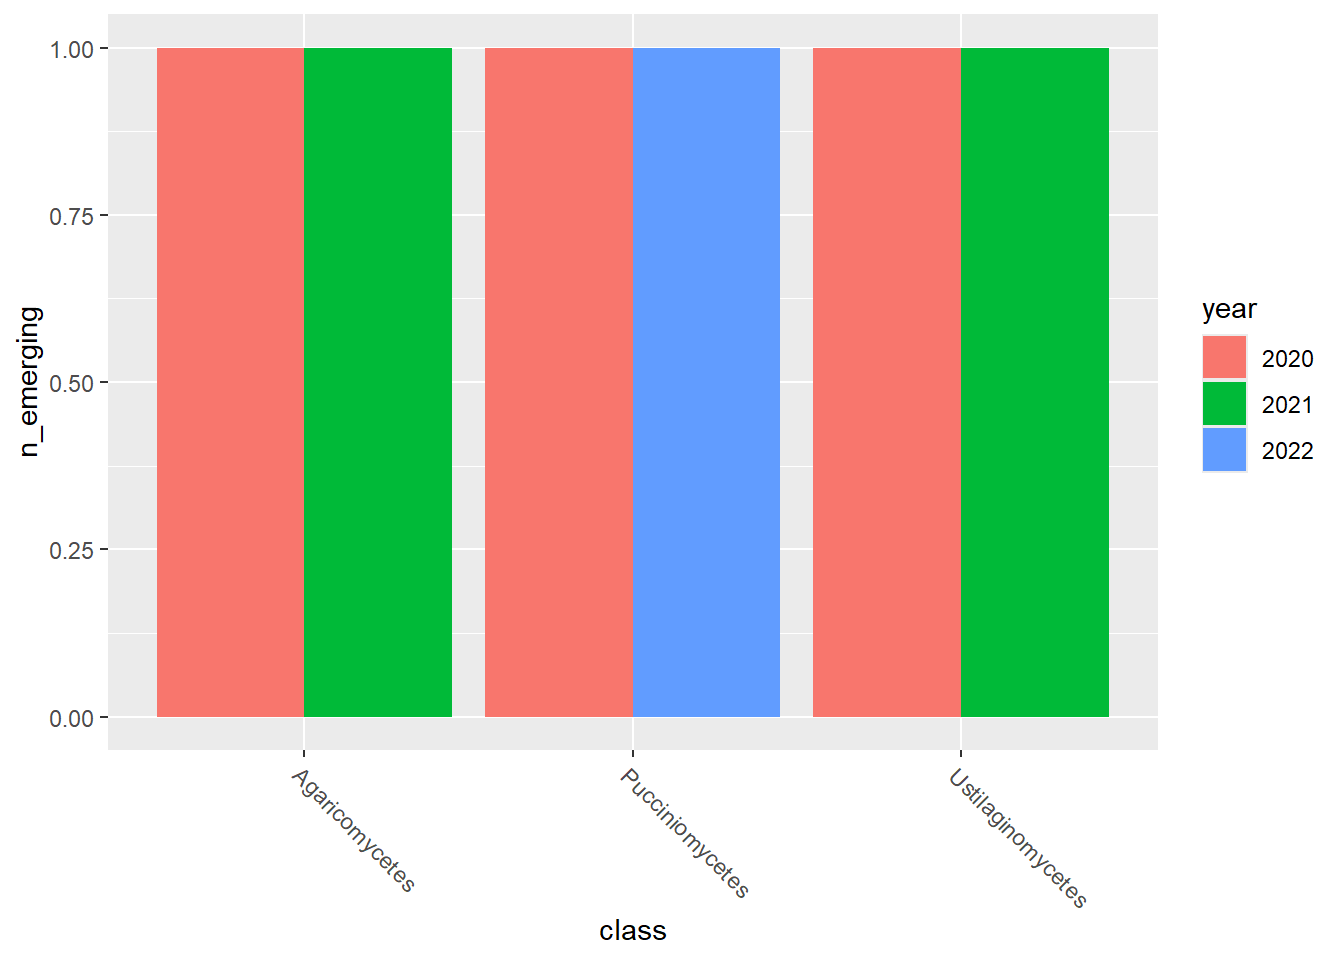
##
## [[4]]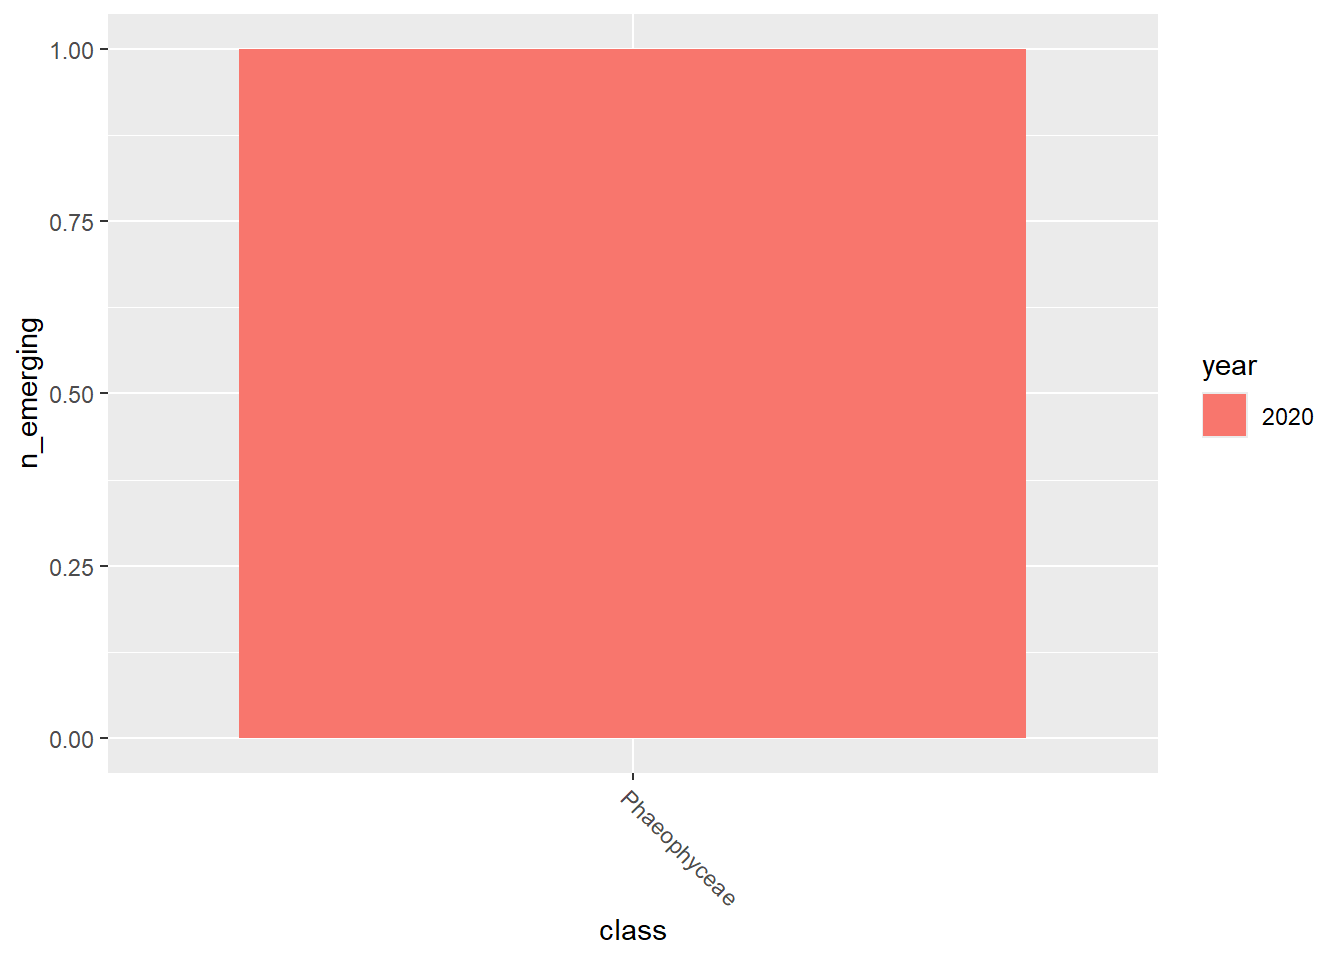
Save both table and graphs:
readr::write_tsv(
  emerging_df_BE_occs,
  here::here(
    "data",
    "output",
    "taxonomic_distribution_emerging_species",
    "n_emerging_taxa_per_class_in_Belgium_occs.tsv"
  ),
  na = ""
)
purrr::walk2(
  emerging_plots_BE_occs,
  kingdoms$kingdom,
  function(x, y) {
    ggplot2::ggsave(
      here::here(
        "data",
        "output",
        "taxonomic_distribution_emerging_species",
        paste0(
          "n_emerging_taxa_per_class_in_Belgium_occs_",
          y, ".png"
        )
      ),
      x
    )
  }
)
4.2.4 Number of occurrences: Natura2000
Table:
emerging_df_Natura2000_occs <-
  emerging_df %>%
  tidylog::filter(.data$area == "Natura2000" & .data$variable == "occs")
emerging_df_Natura2000_occs
Graphs:
emerging_plots_Natura2000_occs <- purrr::map(kingdoms$kingdom, function(x) {
  data <- emerging_df_Natura2000_occs %>%
    tidylog::filter(.data$kingdom == x & .data$n_emerging > 0)
  ggplot2::ggplot(data) +
    ggplot2::geom_col(aes(x = class, y = n_emerging, fill = year),
      position = "dodge"
    ) +
    ggplot2::theme(
      axis.text.x = ggplot2::element_text(
        angle = 315,
        hjust = 0,
        vjust = 1
      )
    )
})
emerging_plots_Natura2000_occs
## [[1]]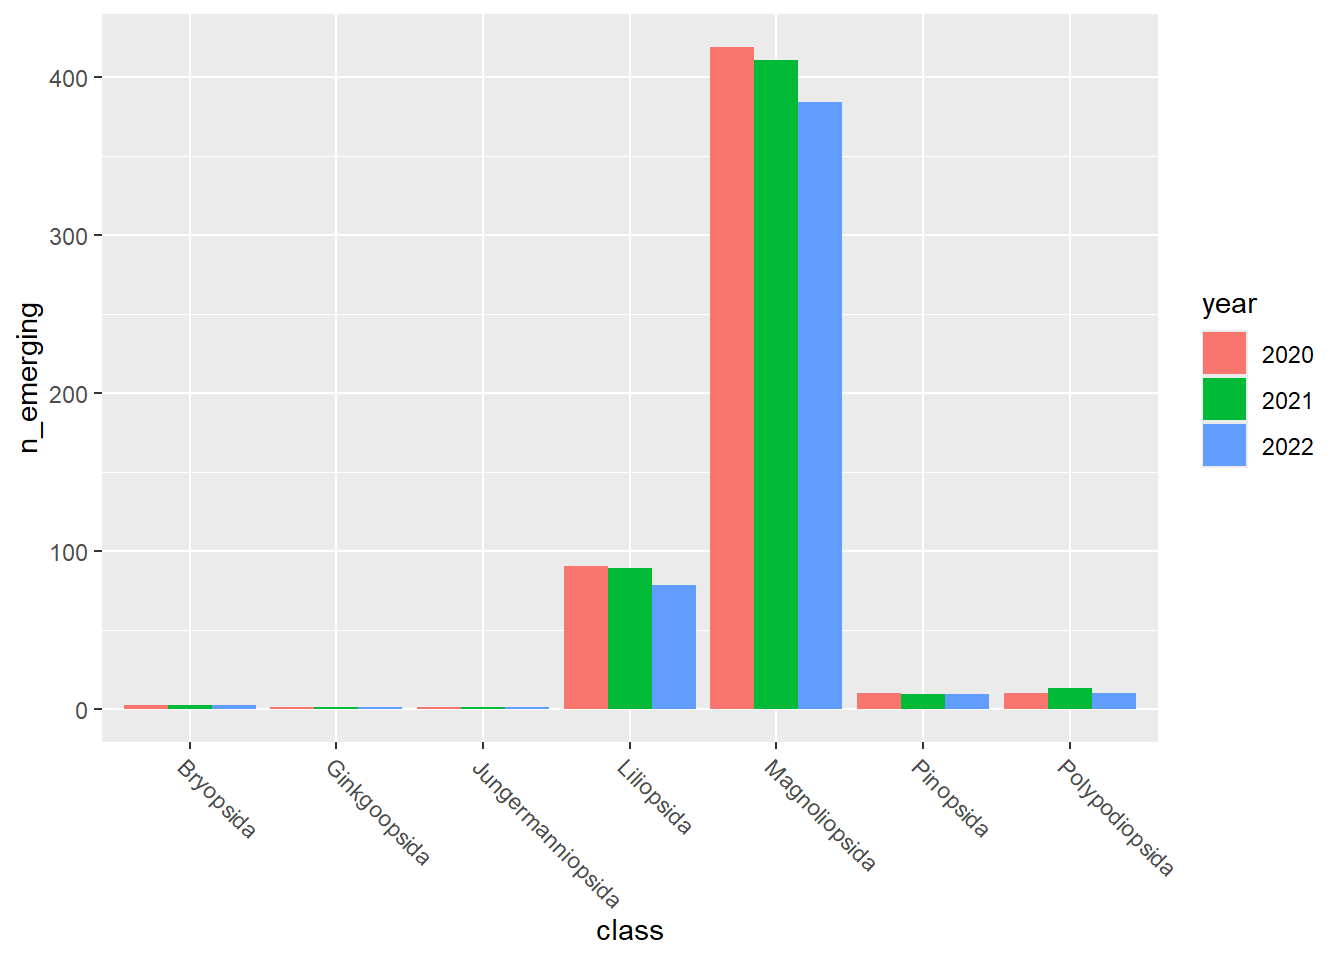
##
## [[2]]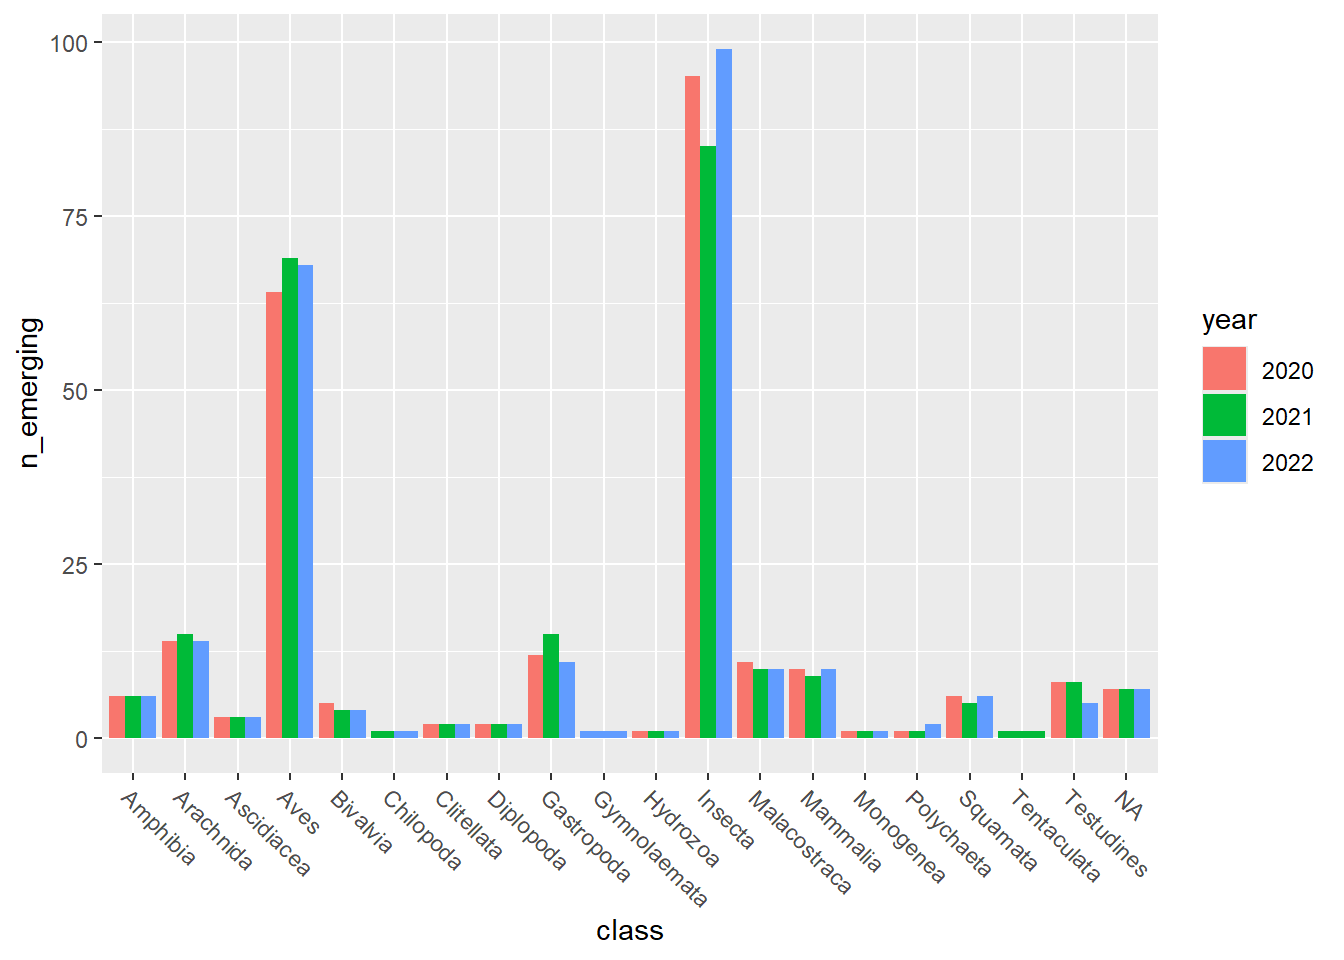
##
## [[3]]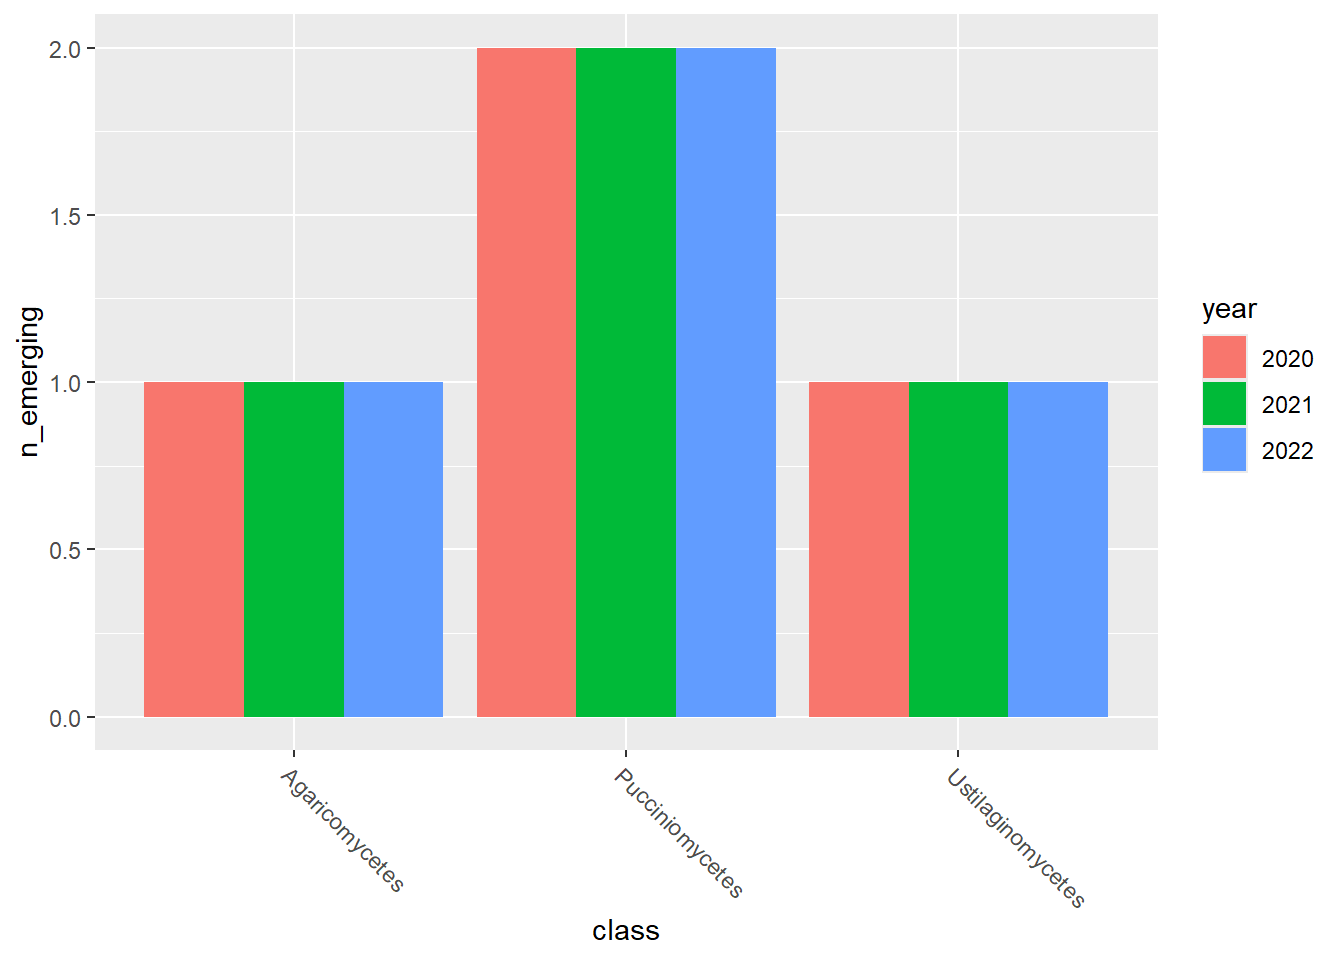
##
## [[4]]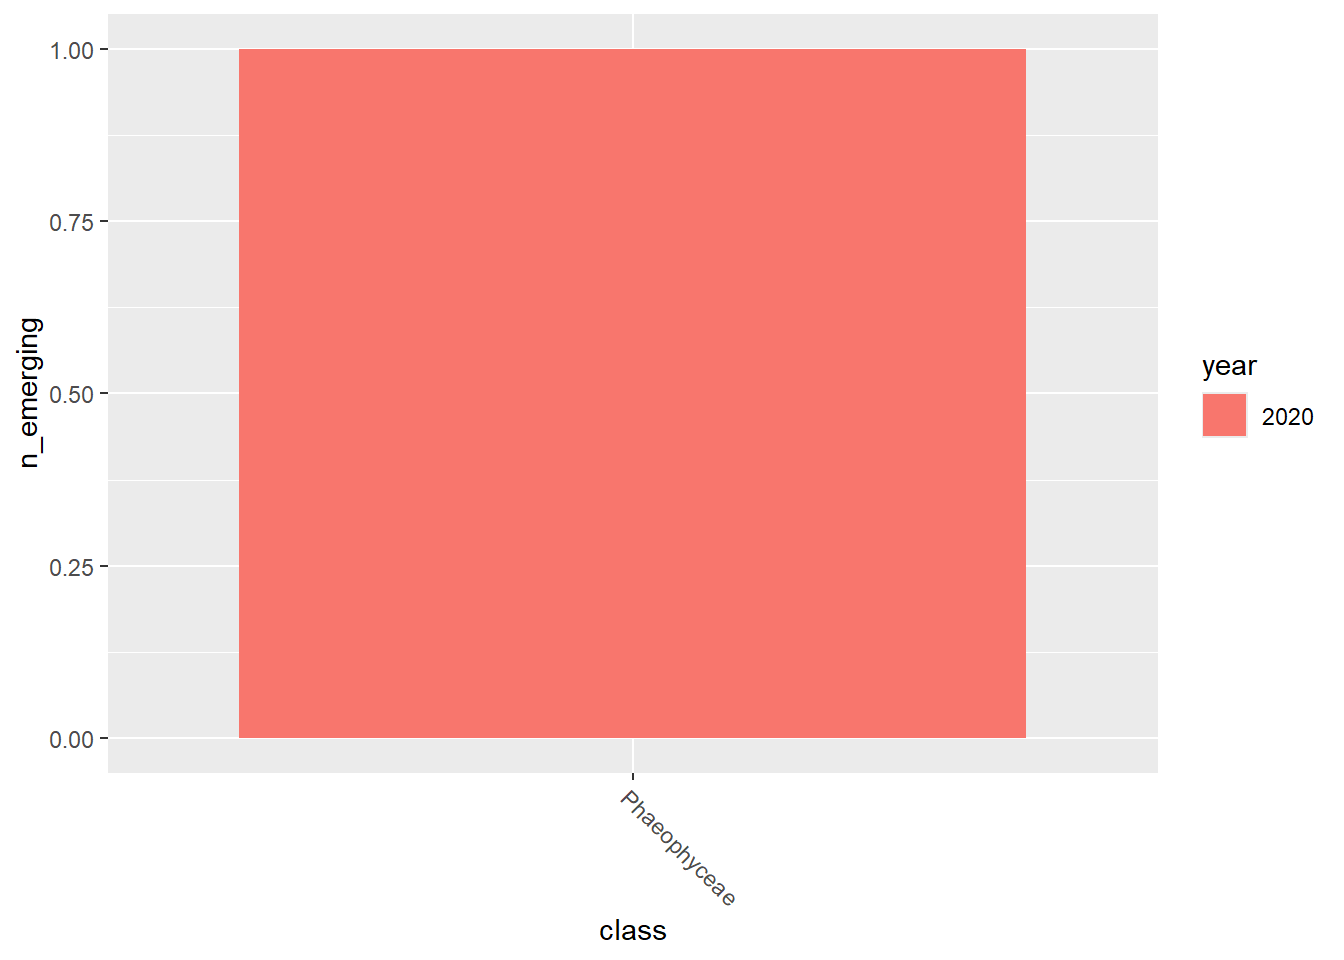
Save both table and graphs:
readr::write_tsv(
  emerging_df_Natura2000_occs,
  here::here(
    "data",
    "output",
    "taxonomic_distribution_emerging_species",
    "n_emerging_taxa_per_class_in_Natura2000_occs.tsv"
  ),
  na = ""
)
purrr::walk2(
  emerging_plots_Natura2000_occs,
  kingdoms$kingdom,
  function(x, y) {
    ggplot2::ggsave(
      here::here(
        "data",
        "output",
        "taxonomic_distribution_emerging_species",
        paste0(
          "n_emerging_taxa_per_class_in_Natura2000_occs_",
          y, ".png"
        )
      ),
      x
    )
  }
)